
Description
Ce que cet indicateur analyse
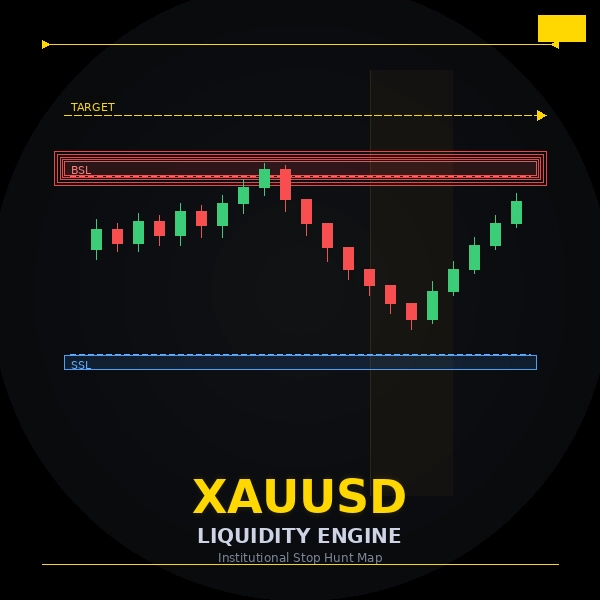
Le moteur de liquidité XAUUSD cartographie les clusters de stop-loss au-dessus et en dessous du prix — la liquidité en attente vers laquelle le prix est attiré à plusieurs reprises avant de rebondir. Il évalue chaque zone selon la probabilité, met en évidence la cible la plus probable de chaque côté, et assemble une configuration de trading complète lorsque votre biais de session et une cible s’alignent.
Conçu exclusivement pour l’Or (XAUUSD). Fonctionne sur M5, M15, M30 et H1.
Nouveautés en v2.1 — le cadre complet des killzones ICT
Les killzones sont désormais ancrées à l’heure locale de New York et s’ajustent automatiquement à l’heure d’été américaine, de sorte que les fenêtres restent correctes toute l’année — pas seulement pendant une moitié. Les quatre killzones ICT sont incluses :
- Asiatique killzone
- Londres killzone
- New York killzone
- Clôture de Londres killzone
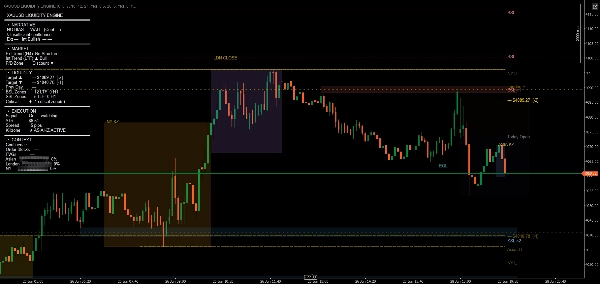
Chaque killzone est dessinée comme une boîte délimitée par le plus haut et le plus bas propres à cette session — la plage réelle sur laquelle la session a été négociée — au lieu d’une bande de fond pleine hauteur. Cette plage est la liquidité : le plus haut et le plus bas de la session sont exactement les niveaux que les sessions suivantes recherchent.
Comment lire le graphique
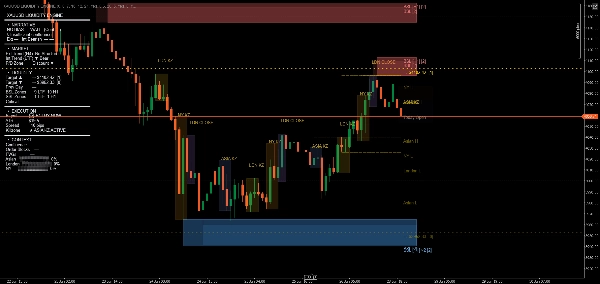
- Zones rouges (BSL) — clusters de stops côté achat au-dessus du prix. Souvent balayés avant une baisse.
- Zones bleues (SSL) — clusters de stops côté vente en dessous du prix. Fréquemment touchés avant une hausse.
- ★ Zones premium — notées de 7 à 10 selon sept facteurs de confluence (chevauchement H1 MTF, FVG, plus hauts/bas égaux, niveau de session, PDH/PDL, nombre rond, niveau magnétique). Elles ressortent clairement sur le graphique.
- Boîtes killzone — les quatre sessions ICT, chacune encadrant sa propre plage du plus haut au plus bas.
- Lignes cibles de liquidité — la cible la plus probable au-dessus et en dessous du prix, chacune avec un badge de score.
- Plus haut / plus bas du jour précédent — tracés à la frontière de la journée ICT minuit-New York et étendus jusqu’à la fin de la journée de trading en cours, pour que les niveaux clés d’aujourd’hui soient toujours visibles.
- Panneau de configuration de trade — lorsque le biais de session et une cible s’alignent, le tableau de bord affiche la direction, la zone d’entrée, le stop, la cible et le ratio R:R.
Le tableau de bord
Un tableau de bord sectionné, intégré au graphique, permet de lire l’image actuelle en un coup d’œil :
- Narratif — lecture en langage clair du biais et de l’objectif
- Marché — structure H4 / LTF et zone premium / discount
- Liquidité — cibles, niveaux du jour précédent, compte des zones BSL / SSL
- Exécution — signal en direct, ATR, spread, killzone active
- Contexte — confluence, blocs d’ordres, FVG, participation à la session
Le contraste du texte s’adapte désormais automatiquement à l’arrière-plan de votre graphique — lisible sur un graphique clair ou sombre sans réglage à modifier.
Trois modes
- Débutant — uniquement zones, cibles et biais de session. Graphique épuré, décisions minimales.
- Standard (recommandé) — ajoute FVG, contexte de plage, notation de confluence et le panneau de configuration de trade.
- Pro — tableau de bord complet avec blocs d’ordres, zones H1 MTF, superposition de signal et toutes les couches d’intelligence.
Paramètres clés
- Mode — Débutant / Standard / Pro ; contrôle quelles couches sont visibles
- Killzones — les quatre fenêtres ICT en heure de New York, avec prise en compte de l’heure d’été (ajustables individuellement)
- Base du jour précédent — minuit ICT New York (par défaut) ou quotidien du courtier
- Proximité de confluence — à quelle distance les niveaux doivent être pour compter comme confluence
- Âge max de la zone — nombre de barres avant qu’une zone ne s’estompe
- Distance cible (ATR) — portée maximale de recherche des cibles de liquidité
Cas d’utilisation typiques
- Planification pré-session — voir quel cluster de stops Londres ou New York est susceptible de balayer
- Entrées après balayages — attendre qu’un BSL / SSL soit pris, puis agir sur le retest
- Sélection de cible — utiliser les lignes cibles notées pour cadrer votre prise de profit
- Timing de session — trader avec les fenêtres killzone ICT plutôt que contre elles
Pour qui est-ce
- Traders d’or sur M5–H1 utilisant ICT, SMC ou une analyse basée sur la liquidité
- Traders souhaitant une structure sans redessiner les zones à chaque session
- Débutants désirant une vue claire et guidée (mode Débutant)
- Traders avancés voulant l’image institutionnelle complète (mode Pro)
Notes importantes
- Optimisé pour XAUUSD. Les paramètres par défaut sont ajustés pour la volatilité de l’or.
- Les killzones utilisent l’heure locale de New York et s’ajustent automatiquement à l’heure d’été américaine.
- Le biais de session utilise la structure H4 — laissez charger plus de 200 barres d’historique pour une première lecture précise.
- Le panneau de configuration de trade nécessite que le biais de session et les cibles de liquidité soient activés.
- Le filtre de pic de volume se désactive automatiquement chez les courtiers sans données de volume tick.
ASSET 2 — Entrée dans l’historique des versions (v2.1)
Choisissez le numéro de version qui correspond à votre schéma — la v2.1 est l’étape naturelle après la v2.0 en direct.
Version 2.1 — Juin 2026
- Nouveau : Toutes les quatre killzones ICT désormais incluses — Asiatique, Londres, New York et Clôture de Londres (auparavant seulement Londres + New York).
- Nouveau : Killzones ancrées à l’heure locale de New York avec gestion automatique de l’heure d’été américaine — les fenêtres restent correctes toute l’année.
- Modifié : Chaque killzone est désormais dessinée comme une boîte délimitée par le plus haut et le plus bas réels de la session (la plage de la session), au lieu d’une bande pleine hauteur.
- Modifié : Le plus haut / plus bas du jour précédent utilise désormais la frontière de la journée ICT minuit-New York et s’étend jusqu’à la fin de la journée de trading en cours.
- Nouveau : Contraste automatique du tableau de bord — le texte s’adapte automatiquement à un fond clair ou sombre.
- Amélioré : Tableau de bord réorganisé en sections claires (Narratif / Marché / Liquidité / Exécution / Contexte).
- Amélioré : Étiquettes sur le bord droit — niveaux, cibles et configuration de trade — se désengorgent en une colonne propre ; les étiquettes killzone sont décalées pour que les sessions adjacentes ne se chevauchent jamais.
ASSET 3 — Plan de captures d’écran (8 emplacements)
Règles générales de capture :
- Capturer pendant les heures de marché actives pour que le spread soit réaliste et qu’un signal puisse s’afficher (éviter l’état « Spread 40 pips / Signal Off » du week-end dans les captures principales).
- Maintenir un zoom cohérent et un graphique propre (cacher les objets non liés).
- Le contraste automatique gère les deux thèmes — envisager une capture sur fond clair et une sur fond sombre pour montrer la plage.
- Même symbole XAUUSD tout au long pour la cohérence.
#Capture Ce qu’elle doit montrer Pourquoi elle vend
1
Vue d’ensemble héroïque
Mode standard, graphique complet : 4 boîtes killzone, PDH/PDL, lignes cibles, tableau de bord lisible
Première impression — « c’est un outil complet et professionnel pour l’or »
2
Les 4 killzones
Une journée complète avec les boîtes Asie / Londres / NY / Clôture de Londres étiquetées, chacune épousant sa plage de session
La fonctionnalité phare de la v2.1 ; signale la justesse authentique de l’ICT
3
Signal actif ⭐
Mode Pro, superposition de signal activée, configuration imprimée : zone d’entrée, étiquettes SL / TP1 / TP2, R:R, panneau de configuration de trade rempli
Montre la fonctionnalité phare de configuration de trade ET la colonne d’étiquettes propre
4
Zones de liquidité
Zones BSL (rouge) + SSL (bleu) avec ★ zones premium qui ressortent, scores visibles
Démontre le moteur de notation / probabilité
5
Cibles de liquidité
Lignes cibles dorées en pointillés au-dessus/en dessous du prix avec badges de score
Montre la projection de la « prochaine cible » en un coup d’œil
6
Détail du tableau de bord
Tableau de bord recadré et zoomé avec les cinq sections lisibles
Prouve la profondeur sans surcharger le graphique
7
Trois modes
Débutant vs Standard vs Pro (recadrages empilés ou côte à côte)
Montre la progression du propre→complet ; élargit la base d’acheteurs
8
Niveaux clés
PDH/PDL étendus jusqu’à la fin de la journée + étiquettes H/L de session dans une colonne ordonnée
Renforce la valeur « connaître toujours vos niveaux »
Priorité si vous ne rafraîchissez que quelques-uns : #1, #2, #3 portent la mise à jour. Le #3 est aussi la dernière confirmation QA — le capturer vérifie que les étiquettes SL/TP ne se chevauchent pas avec un signal en direct.
Résumé
Key features include color-coded liquidity zones (red for buy-side stops above price, blue for sell-side stops below), premium zones scored across multiple confluence factors, and liquidity target lines with probability scores. The indicator also displays Previous Day High/Low levels based on the ICT midnight-New York day boundary.
A comprehensive on-chart dashboard provides a plain-language narrative of session bias and objectives, market structure, liquidity details, execution signals, and contextual information such as order blocks and fair value gaps. The dashboard adapts text contrast automatically for light or dark chart backgrounds.
Users can select from three modes—Beginner (simplified view), Standard (adds confluence and trade setup), and Pro (full institutional-level detail). The indicator supports pre-session planning, entry timing after liquidity sweeps, target selection, and session timing aligned with ICT killzones.
Avis clients
5 | 33 % | |
4 | 67 % | |
3 | 0 % | |
2 | 0 % | |
1 | 0 % |


