
Mô tả
ICT Killzones Complete – Phân Tích Phiên Giao Dịch Chuyên Nghiệp
Làm chủ thời điểm giao dịch tổ chức với chỉ báo ICT Killzones toàn diện nhất cho cTrader. Công cụ chuyên nghiệp này tự động xác định và hiển thị tất cả năm phiên giao dịch ICT (Inner Circle Trader) quan trọng, giúp bạn có lợi thế giao dịch cùng với tiền thông minh.
Có gì mới trong phiên bản này:
- Tất cả 5 Phiên ICT: Bao phủ đầy đủ bao gồm Asian Range, London Kill Zone, New York Kill Zone, NY Lunch/Reversal Zone, và NY PM Kill Zone
- Hệ Thống Màu Thông Minh: Tên màu đơn giản (Đỏ, Xanh Dương, Cam) thay vì mã ARGB phức tạp
- Điều Khiển Độ Trong Suốt Độc Lập: Điều chỉnh độ mờ cho từng phiên (0-100%)
- Màu Nhãn Riêng Cho Từng Phiên: Tùy chỉnh màu nhãn độc lập với màu vùng
- Mô Tả Phiên: Nhãn thông tin tùy chọn giải thích đặc điểm của từng phiên
- Hiệu Suất Cải Tiến: Mã tối ưu với việc tự động dọn dẹp các vùng cũ
Tính Năng Chính:
📊 Bao Phủ Phiên Hoàn Chỉnh:
- Asian Range (19:00-00:00 NY): Xác định các vùng tích lũy và bể thanh khoản cho các đợt tấn công sau
- London Kill Zone (02:00-05:00 NY): Đánh dấu các đỉnh biến động lớn lý tưởng cho việc săn điểm dừng và đảo chiều
- NY Kill Zone (07:00-10:00 NY): Làm nổi bật đợt di chuyển lớn thứ hai với động lượng mạnh
- NY Lunch Zone (12:00-13:30 NY): Hiển thị các giai đoạn đảo chiều và tích lũy
- NY PM Kill Zone (13:30-16:00 NY): Bắt các đợt di chuyển thứ cấp và cân bằng lại thị trường
🎨 Tùy Chỉnh Màu Dễ Dàng:
- Tên màu đơn giản: chỉ cần gõ "Blue", "Orange", "Purple", v.v.
- Hơn 50 màu định sẵn bao gồm DodgerBlue, BlueViolet, MediumAquamarine
- Hỗ trợ màu Hex (#RRGGBB)
- Thanh trượt độ trong suốt riêng biệt (0-100%) cho từng vùng
- Màu nhãn riêng biệt để rõ ràng tối đa
⚙️ Tùy Chọn Hiển Thị Mạnh Mẽ:
- Bật/tắt từng phiên riêng lẻ
- Hiện/ẩn nhãn thông tin phiên
- Điều chỉnh kích thước phông chữ (6-20)
- Mở rộng vùng đến mép biểu đồ hoặc giữ trong phạm vi
- Kiểm soát số ngày lịch sử hiển thị (1-30 ngày)
- Tự động dọn dẹp tránh làm rối biểu đồ
🎯 Thiết Kế Chuyên Nghiệp:
- Hiển thị sạch sẽ, không gây phiền nhiễu
- Theo dõi đỉnh/đáy động trong các phiên hoạt động
- Xử lý đúng các phiên qua đêm
- Hoạt động trên tất cả các khung thời gian
- Không trễ, hiệu suất tối ưu
Phù Hợp Cho:
- Những nhà giao dịch theo phương pháp ICT tìm kiếm thời điểm chính xác
- Nhà giao dịch tiền thông minh theo dõi dòng tiền tổ chức
- Nhà giao dịch trong ngày và scalper cần ranh giới phiên chính xác
- Nhà giao dịch swing xác định vùng đảo chiều chính
- Bất kỳ ai muốn căn chỉnh giao dịch với các phiên thị trường chính
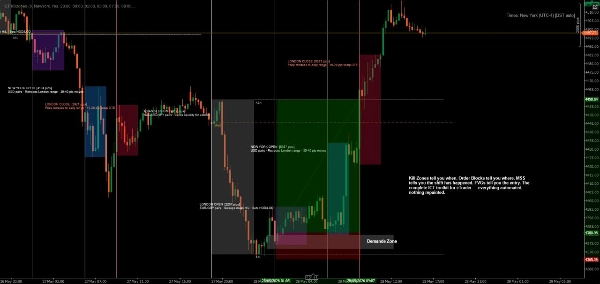
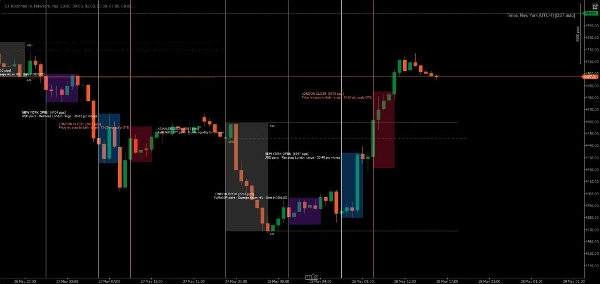
Cách Thức Hoạt Động:
Chỉ báo tự động phát hiện từng ngày giao dịch và tạo các vùng mã màu cho tất cả năm phiên ICT. Khi giá di chuyển qua từng phiên, chỉ báo theo dõi đỉnh và đáy, sau đó vẽ vùng cuối cùng khi phiên kết thúc. Nhãn rõ ràng xác định từng phiên và tùy chọn hiển thị đặc điểm giao dịch của nó.
Tất cả thời gian đều theo giờ New York (Eastern), theo phương pháp ICT tiêu chuẩn.
Ví Dụ Tùy Chỉnh:
- Cài Đặt Thận Trọng: Độ trong suốt thấp (20-30%), màu sắc nhẹ nhàng, không có thông tin phiên
- Cài Đặt Táo Bạo: Độ trong suốt cao (70-80%), màu sắc sống động, mô tả phiên đầy đủ
- Cài Đặt Tối Giản: Tắt các phiên không mong muốn, chỉ giữ killzones bạn thích
- Chiến Lược Mã Màu: Phù hợp màu vùng với xu hướng giao dịch của bạn (xanh lá = mua, đỏ = bán)
Yêu Cầu Hệ Thống:
- Nền Tảng: cTrader Desktop (sản phẩm cTrader Store không hỗ trợ trên phiên bản Web hoặc Mobile) blog.ctrader.com
- Hệ Điều Hành: Windows 7 trở lên
- Bộ Xử Lý: Khuyến nghị CPU hai nhân
- Bộ Nhớ: Tối thiểu 2 GB RAM (khuyến nghị 4 GB)
- Kết Nối Internet: 50 kB mỗi giây hoặc nhanh hơn
Hướng Dẫn Cài Đặt:
- Mua/Cài Đặt: Lấy chỉ báo từ cTrader Store
- Tải cTrader Desktop: Nếu chưa cài, tải từ ctrader.com
- Đăng Nhập: Mở cTrader Desktop và đăng nhập bằng cTrader ID của bạn
- Truy Cập Chỉ Báo: Điều hướng đến phần "Algo" → danh sách "Indicators"
- Thêm Vào Biểu Đồ: Nhấp chuột phải vào bất kỳ biểu đồ nào → "Indicators" → Chọn "ICT Killzones Complete"
- Tùy Chỉnh: Nhấp chuột phải tên chỉ báo trên biểu đồ → "Settings" để điều chỉnh màu sắc, thời gian và tùy chọn hiển thị
Mẹo Để Có Kết Quả Tốt Nhất:
- Sử dụng trên khung thời gian từ 1 phút đến 1 giờ để có độ hiển thị tối ưu
- Kết hợp với hành động giá và khái niệm thanh khoản để có kết quả tốt nhất
- Điều chỉnh thời gian phiên nếu nhà môi giới của bạn sử dụng múi giờ khác
- Thử nghiệm độ trong suốt để tìm sự cân bằng hình ảnh hoàn hảo
- Bật nhãn thông tin phiên khi học, tắt để biểu đồ gọn gàng hơn
Giao Dịch Chính Xác. Giao Dịch Tự Tin. Giao Dịch Theo Phương Pháp ICT.
Lưu ý: Chỉ báo này chỉ dành cho mục đích giáo dục và thông tin. Hiệu suất trong quá khứ không đảm bảo kết quả tương lai. Luôn thực hành quản lý rủi ro đúng cách.
Tóm tắt
The indicator tracks high and low prices during active sessions and finalizes zones upon session close, providing clear visual boundaries for institutional trading timing. It supports all timeframes, handles overnight sessions properly, and includes automatic cleanup of old zones to maintain chart clarity. Customization options include font size adjustment, zone extension control, and history length for displayed zones. ICT Killzones Complete is suitable for traders using ICT methodology, smart money concepts, scalping, day trading, and swing trading across markets such as Forex, commodities, and crypto. It requires cTrader Desktop on Windows 7 or higher with recommended hardware specifications.
Đánh giá của khách hàng
5 | 50 % | |
4 | 25 % | |
3 | 0 % | |
2 | 25 % | |
1 | 0 % |


