
Mô tả
Gann Pivot Vision là một công cụ phân tích sáng tạo kết hợp các mức đảo chiều pivot cổ điển và hình học Gann, cho phép các nhà giao dịch nhận diện trực quan các mức hỗ trợ/kháng cự chính và dự đoán các điểm đảo chiều thị trường với độ chính xác cao.
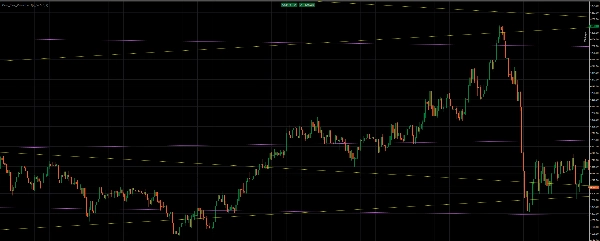
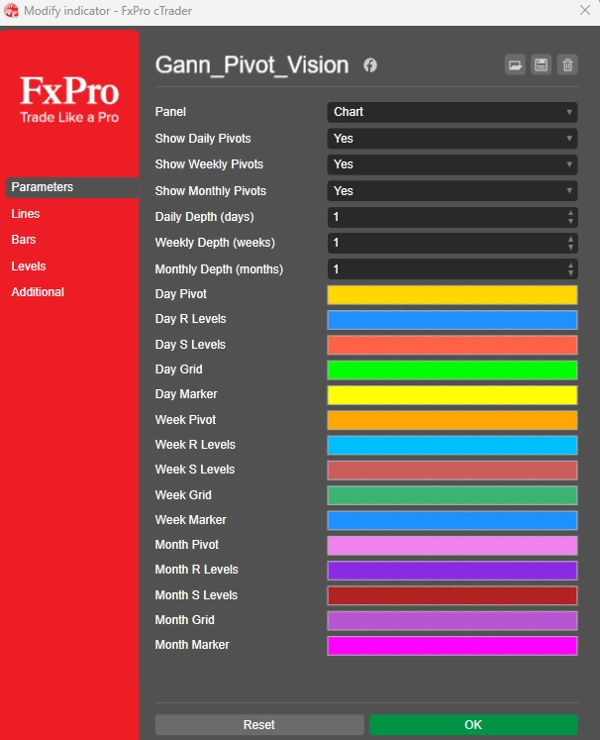
Chỉ báo tự động xây dựng:
✔ Các mức Pivot hàng ngày
✔ Các mức Pivot hàng tuần
✔ Các mức Pivot hàng tháng
Mỗi khung thời gian được hiển thị với bảng màu riêng và có thể được bật hoặc tắt nếu cần thiết.
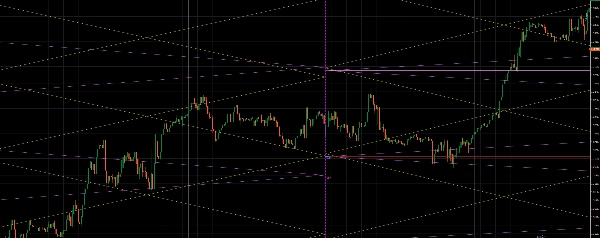
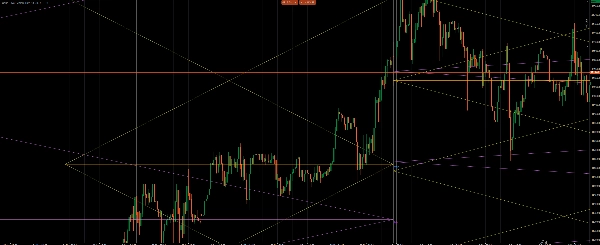
🔷 Lưới Gann và cấu trúc chéo
Ngoài ra, công cụ tạo ra một lưới Gann hình kim cương dựa trên phạm vi của kỳ trước.:
◾ Các đường chéo (đối xứng Gann)
◾ Các giao điểm hình học — khu vực phản ứng thị trường chính
◾ Trung tâm của cấu trúc = giá trung tâm của kỳ (Điểm Pivot)
Sự kết hợp này cho phép bạn:
🔹 xác định các cụm giá mạnh
🔹 xác định các khu vực có khả năng đảo chiều
🔹 xác nhận tín hiệu xu hướng và ngược xu hướng
Tóm tắt
Đánh giá của khách hàng
5 | 0 % | |
4 | 100 % | |
3 | 0 % | |
2 | 0 % | |
1 | 0 % |


![Logo "[Stellar Strategies] MARSI Signal Plotter"](https://cdn.ctrader.com/image/webp/7b2b8da6-8f8e-4646-8d4a-4710c516c01e_25567)
![Logo "[Hamster-Coder] Bollinger Bands"](https://cdn.ctrader.com/image/webp/21d8e5d6-fb11-4bac-b9ee-cd05c2b76804_30327)


![Logo "[Stellar Strategies] Market Session Ultimate"](https://cdn.ctrader.com/image/webp/61ffd537-0125-4246-9e72-42eca1791d64_28232)

