
WaveWeisBarForce
Indicador
169 transferências
Versão 1.0, Dec 2025
Windows, Mac
5.0
Avaliações: 2
Descrição
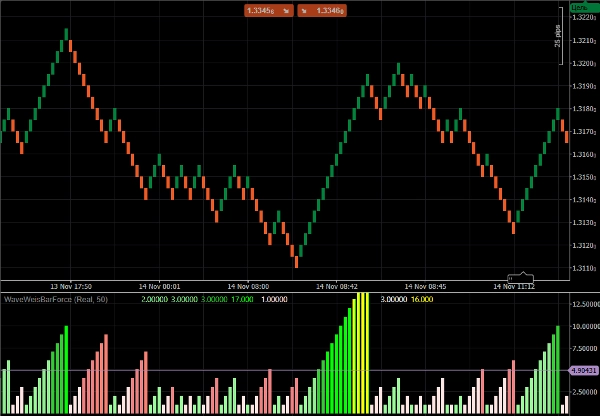
Wave Weis Bar Force - é um indicador que aplica a lógica das ondas de volume (Weis) para determinar a acumulação e as mudanças na direção do mercado.
Ele resume o volume enquanto a tendência permanece inalterada. Quando a direção muda, uma nova onda começa e a acumulação é reiniciada.
A intensidade é calculada por níveis, de acordo com a relação entre o volume da onda atual e a maior acumulação recente. Serve como um filtro adicional e funciona bem em estratégias de tendência.
Resumo
Resumo de IA
Wave Weis Bar Force is a technical indicator that applies the concept of Volume Waves (Weis) to identify market accumulation phases and detect changes in market direction. It aggregates volume data while the current trend persists, resetting accumulation when a new wave begins with a trend reversal. The indicator calculates intensity levels based on the ratio of the current wave's volume to the largest recent accumulation, providing a quantitative measure of volume strength. This functionality serves as an additional filter and is particularly useful in trending market strategies. The indicator supports analysis across multiple markets including Forex, Crypto, and Stocks, and is applicable to trading approaches such as breakout and scalping strategies.
Perfil do indicador
Avaliações de clientes
5.0
Avaliações: 2
5 | 100 % | |
4 | 0 % | |
3 | 0 % | |
2 | 0 % | |
1 | 0 % |
Avaliações de clientes
December 10, 2025
WaveWeisBarForce blends Weis Wave logic with bar-strength analysis to show real buying/selling force. Clean histogram, stable performance, great for confirming impulses and spotting exhaustion. Useful for Wyckoff, VSA and intraday momentum traders.
Conversa
Perguntas frequentes
Forex
Breakout
Scalping
Crypto
Stocks
Os produtos disponíveis através da cTrader Store, incluindo bots de negociação, indicadores e plugins, são fornecidos por programadores terceiros e são disponibilizados apenas para fins informativos e de acesso técnico. A cTrader Store não é um corretor e não fornece aconselhamento em matéria de investimento, recomendações pessoais ou qualquer garantia de desempenho no futuro.
Mais deste autor


![Logótipo de "[Hamster-Coder] Pivot Points MTF"](https://cdn.ctrader.com/image/webp/4c143e5a-309c-40e3-a578-f04d1e133ffa_31159)


Preço
Desde 24/10/2025
1.43M
Volume negociado
4.79K
Pips ganhos
2
Vendas
317
Instalações gratuitas