
Описание
Gann Pivot Vision — это инновационный аналитический инструмент, который сочетает классические уровни разворота пивота и геометрию Ганна, позволяя трейдерам визуально определять ключевые уровни поддержки/сопротивления и с высокой точностью прогнозировать развороты рынка.
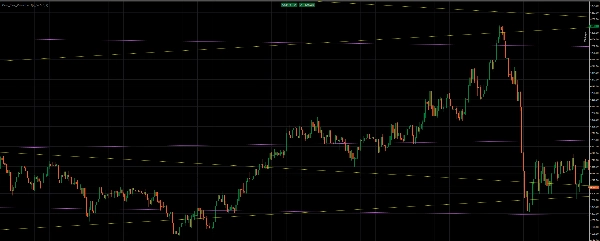
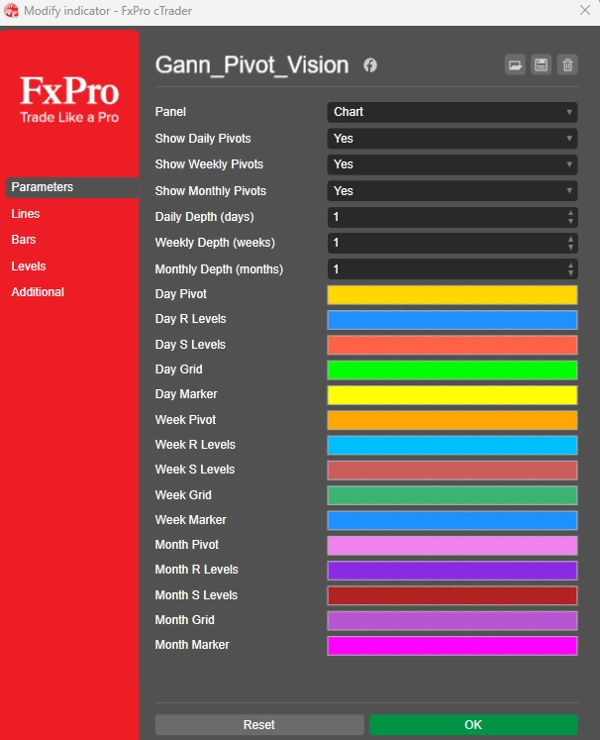
Индикатор автоматически строит:
✔ Дневные уровни пивота
✔ Недельные уровни пивота
✔ Месячные уровни пивота
Каждый таймфрейм отображается своей цветовой схемой и может быть включен или отключен при необходимости.
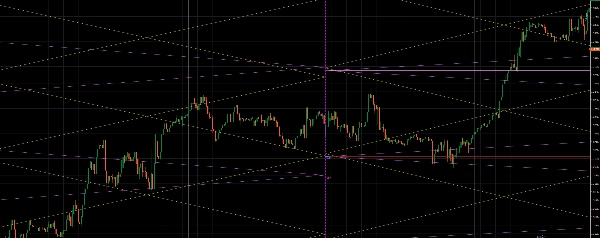
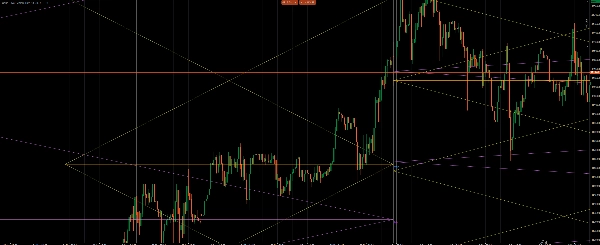
🔷 Сетка Ганна и диагональная структура
Кроме того, инструмент генерирует ромбовидную сетку Ганна на основе диапазона предыдущего периода.:
◾ Диагональные линии (симметрия Ганна)
◾ Геометрические пересечения — области ключевых рыночных реакций
◾ Центр структуры = центральная цена периода (Pivot Point)
Это сочетание позволяет:
🔹 выявлять сильные ценовые кластеры
🔹 определять области вероятного разворота
🔹 подтверждать сигналы тренда и контртренда
Сводка
Отзывы покупателей
5 | 0 % | |
4 | 100 % | |
3 | 0 % | |
2 | 0 % | |
1 | 0 % |


![Логотип продукта "[Stellar Strategies] Market Session Ultimate"](https://cdn.ctrader.com/image/webp/61ffd537-0125-4246-9e72-42eca1791d64_28232)


