
Описание
The Wyckoff Schematic Indicator — это профессиональный инструмент для анализа рыночной структуры, предназначенный для автоматического обнаружения и визуализации фаз накопления и распределения по Уайкоффу непосредственно на графике.
Основанный на принципах метода Уайкоффа, этот индикатор выявляет ключевые институциональные события, такие как Selling Climax (SC), Automatic Rally (AR), Spring, Sign of Strength (SOS), Buying Climax (BC), Upthrust (UTAD) и другие — помогая трейдерам понимать поведение умных денег в реальном времени.
В отличие от традиционных индикаторов, этот инструмент не опирается на запаздывающие сигналы, а сосредоточен на структуре цены, поведении объёма и волатильности, предоставляя более глубокое понимание динамики рынка.
Основная концепция
Индикатор основан на идее, что рынки движутся через структурированные циклы:
- Накопление → Рост → Распределение → Падение
Он автоматически обнаруживает и визуализирует:
- Рыночные диапазоны
- Фазы Уайкоффа (A–E)
- Ключевые институциональные события
- Структурные пробои и ложные пробои
Ключевые особенности
1. Автоматическое определение фаз Уайкоффа
Индикатор определяет все основные фазы цикла Уайкоффа:
- Фаза A – остановка тренда
- Фаза B – формирование причины (образование диапазона)
- Фаза C – Spring / UTAD (ложный пробой)
- Фаза D – подтверждение тренда (SOS / SOW)
- Фаза E – продолжение тренда
Каждая фаза визуально выделена с помощью настраиваемых цветов для мгновенного распознавания.
2. Распознавание ключевых событий
Система обнаруживает критические события по Уайкоффу:
Накопление:
- SC – Selling Climax
- AR – Automatic Rally
- ST – Secondary Test
- Spring – Ложный пробой вниз
- SOS – Sign of Strength
- LPS – Последняя точка поддержки
Распределение:
- BC – Buying Climax
- AR – Automatic Reaction
- ST – Secondary Test
- UTAD – Upthrust After Distribution
- SOW – Sign of Weakness
- LPSY – Последняя точка предложения
Эти события отображаются непосредственно на графике с метками.
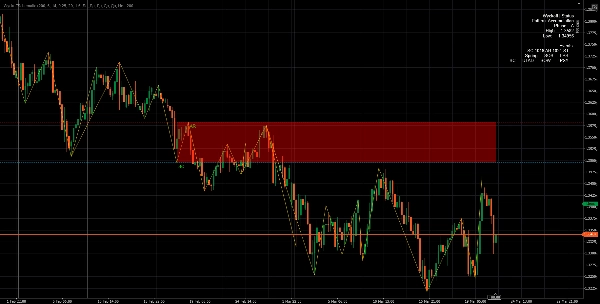
3. Адаптивное определение диапазонов
Индикатор динамически строит и обновляет торговые диапазоны:
- Автоматически определяет максимумы и минимумы диапазона
- Корректирует границы с помощью допуска на основе ATR
- Отображает зоны поддержки и сопротивления
Это позволяет трейдерам чётко видеть, где рынок накапливается или распределяется.
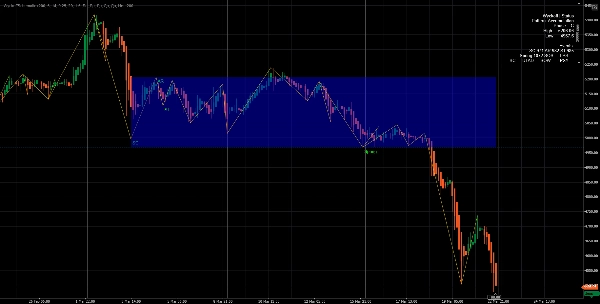
4. Движок структуры ZigZag
Встроенная система ZigZag на основе пивотов:
- Фильтрует рыночный шум
- Выделяет истинные структурные максимумы и минимумы
- Обеспечивает точное распознавание паттернов
Это важно для надёжного определения структур Уайкоффа.
5. Интеграция объёма и волатильности
Индикатор использует:
- Скользящую среднюю объёма
- Обнаружение всплесков объёма
- ATR (средний истинный диапазон)
Это позволяет:
- Подтверждать институциональную активность
- Фильтровать ложные сигналы
- Повышать точность событий, таких как SC, BC, Spring, UTAD
6. Логика конечного автомата в реальном времени
В основе индикатора лежит алгоритм конечного автомата, который:
- Отслеживает эволюцию рыночной структуры
- Переходит между фазами (A → E)
- Предотвращает дублирование сигналов
- Поддерживает контекст (накопление против распределения)
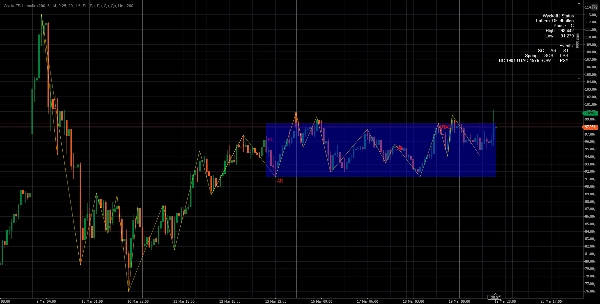
7. Визуальные компоненты
Индикатор предоставляет полный визуальный набор инструментов:
- ✔ Выделение фаз цветными блоками
- ✔ Линии максимумов/минимумов диапазона
- ✔ Линии структуры ZigZag
- ✔ Метки событий на графике
- ✔ Панель состояния в реальном времени
8. Панель состояния (информация о рынке в реальном времени)
Встроенная панель отображает:
- Текущий паттерн (накопление / распределение)
- Текущую фазу (A–E)
- Границы диапазона
- Обнаруженные события
Это даёт трейдерам мгновенный обзор рыночных условий.
9. Система оповещений
Опциональные всплывающие уведомления информируют вас о наступлении ключевых событий:
- SC, BC, Spring, UTAD, SOS, SOW и др.
Идеально подходит для мониторинга нескольких рынков.
Преимущества
✔ Перспектива умных денег
В отличие от обычных индикаторов, этот инструмент следует институциональной логике, а не розничным индикаторам.
✔ Раннее обнаружение сигналов
Определяет накопление/распределение до пробоев, что позволяет:
- Ранние входы
- Лучшие настройки риск/прибыль
✔ Снижение шума
Используя пивоты, ATR и фильтры объёма, индикатор избегает:
- Случайных сигналов
- Рыночного шума
- Ложных пробоев
✔ Полностью автоматический анализ Уайкоффа
Нет необходимости вручную отмечать:
- Фазы
- События
- Диапазоны
Всё определяется автоматически.
✔ Высокая настраиваемость
Вы можете настроить:
- Период обратного просмотра
- Чувствительность пивотов
- Допуск ATR
- Чувствительность объёма
- Визуальные элементы (метки, блоки, линии)
✔ Оптимизированная производительность
- Использует анализ скользящего окна
- Ограничивает количество графических объектов
- Эффективен для торговли в реальном времени
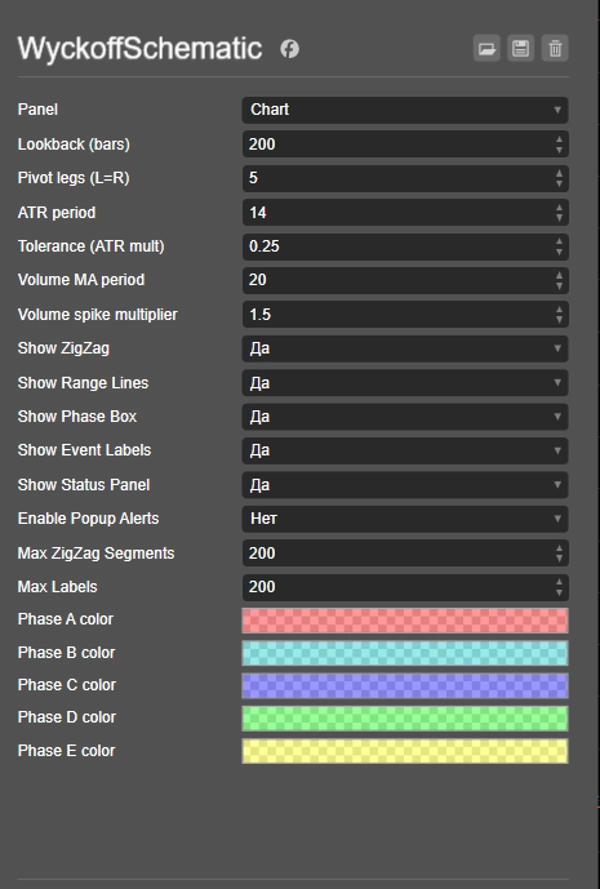
Входные параметры
Структура и чувствительность
- Lookback Bars – диапазон анализа
- Pivot Legs – чувствительность обнаружения колебаний
Волатильность и допуск
- ATR Period
- ATR Multiplier (Tolerance)
Анализ объёма
- Volume MA Period
- Volume Spike Multiplier
Визуализация
- Показывать ZigZag
- Показывать линии диапазона
- Показывать блок фазы
- Показывать метки событий
- Показывать панель состояния
Оповещения
- Включить всплывающие уведомления
Как это работает (упрощённо)
- Обнаруживает пивотные максимумы/минимумы (структура рынка)
- Определяет контекст тренда (восходящий / нисходящий)
- Ищет всплески объёма + структурные условия
- Инициализирует паттерн Уайкоффа (накопление/распределение)
- Отслеживает события и фазы шаг за шагом
- Обновляет визуализацию графика в реальном времени
Лучшие случаи использования
- Торговля умными деньгами / по методу Уайкоффа
- Торговля пробоями
- Торговля в диапазоне
- Обнаружение разворотов
- Анализ институционального потока ордеров
Заключение
The Wyckoff Schematic Indicator — мощный аналитический инструмент, который преобразует сложную теорию Уайкоффа в полностью автоматизированную, визуальную и практическую торговую систему.
Он позволяет трейдерам:
- Понимать намерения рынка
- Определять настройки с высокой вероятностью успеха
- Торговать в соответствии с институциональным поведением
Сводка
Отзывы покупателей
5 | 100 % | |
4 | 0 % | |
3 | 0 % | |
2 | 0 % | |
1 | 0 % |


