Descrição
Revolucione Sua Análise de Gráficos
Entre no futuro da análise técnica com Delta-RSI Candle Pro – o indicador inovador que transforma velas comuns em poderosos visualizadores de momentum. Por que encher sua tela com múltiplos indicadores quando você pode ter tudo que precisa diretamente nas próprias velas?
A Solução Visual de Trading Tudo-em-Um
-
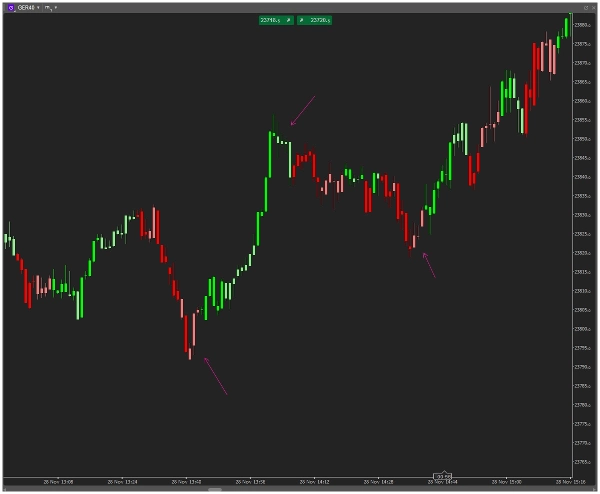
- Reconhecimento Imediato de Sinais: Força e direção do momentum exibidos intuitivamente através da cor
- Maximize o Espaço da Tela: Elimine para sempre painéis separados de osciladores
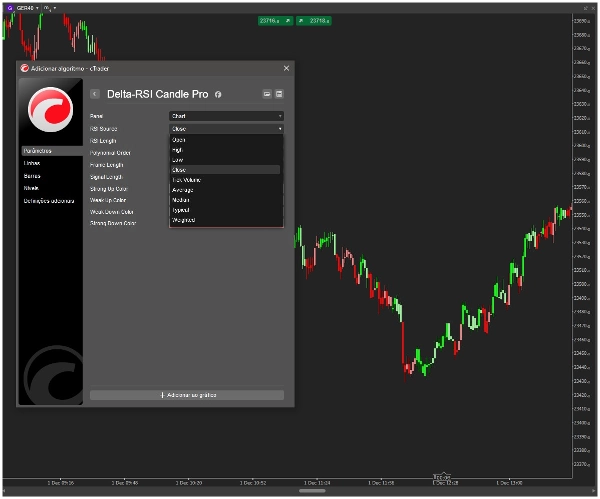
- Precisão Matemática: Regressão polinomial avançada calcula o verdadeiro momentum do RSI
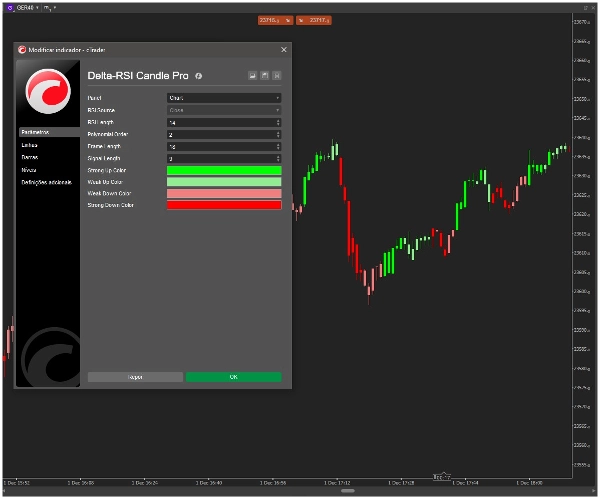
- Personalização Completa: Use os seletores de cor nativos do cTrader para combinar com seu estilo de trading
- Confiável & Preciso: Cálculos sem repintura baseados em dados de preço confirmados
Como o Delta-RSI Candle Pro Funciona
Nosso algoritmo proprietário calcula a derivada instantânea do RSI usando ajuste de curva polinomial, depois atribui cores inteligentes a cada vela:
-
- Forte Alta: Verde intenso – Momentum positivo acelerando
- Alta Moderada: Verde claro – Momentum positivo, mas com cautela
- Baixa Moderada: Vermelho claro – Momentum negativo, mas com potencial de reversão
- Forte Baixa: Vermelho escuro – Momentum negativo acelerando
Principais Características Que Nos Diferenciam
-
- 🎯 Integração Direta nas Velas: As cores aparecem diretamente nas suas velas de trading
- 🎨 Seleção Visual de Cores: Seletores de cor intuitivos do cTrader – sem necessidade de nomes de código
- ⚙️ Totalmente Ajustável: Ajuste fino do comprimento do RSI, ordem polinomial e período de lookback
- 🚀 Desempenho Otimizado: Motor de cálculo leve para operação suave
- 📊 Algoritmo de Grau Profissional: Análise matemática de derivadas para sinais superiores
Quem Se Beneficia Mais?
-
- Day Traders que precisam de sinais visuais instantâneos de momentum
- Swing Traders identificando mudanças de tendência cedo
- Traders Minimalistas que odeiam poluição visual no gráfico
- Traders Algorítmicos buscando confirmação visual
- Todos os Traders Sérios que querem uma vantagem na análise de mercado
Comece em Segundos
-
- Adicione o Delta-RSI Candle Pro ao seu gráfico
- Selecione suas cores preferidas usando os seletores visuais
- Ajuste os parâmetros para combinar com seu timeframe de trading
- Veja imediatamente os padrões de momentum surgirem nas suas velas
Excelência Técnica
-
- Tipo de indicador sobreposto (sem painel separado)
- Algoritmo sem repintura
- Cálculo polinomial da derivada do RSI
- Compatível com todos os símbolos e timeframes
- Atualizações e melhorias regulares
Por Que Isso É Diferente
Enquanto outros indicadores adicionam complexidade, o Delta-RSI Candle Pro simplifica e aprimora. Nós pegamos a análise matemática avançada de momentum e a tornamos visualmente intuitiva. Não é mais necessário dividir a atenção entre preço e indicadores – agora eles funcionam juntos como um sistema coeso.
Pronto para ver seus gráficos de uma maneira revolucionária?...
Resumo
Key features include immediate visual signal recognition through candle coloring, elimination of separate oscillator panels to maximize chart space, and advanced mathematical precision with non-repainting calculations based on confirmed price data. Users can fully customize colors and parameters such as RSI length, polynomial order, and lookback period using cTrader’s native color pickers.
Delta-RSI Candle Pro is compatible with all symbols and timeframes and is optimized for smooth performance with a lightweight calculation engine. It is suitable for day traders, swing traders, minimalist traders, algorithmic traders, and others seeking clear, integrated momentum analysis without chart clutter. The indicator overlays directly on price candles, providing a cohesive system that combines price and momentum information visually.
Avaliações de clientes
5 | 100 % | |
4 | 0 % | |
3 | 0 % | |
2 | 0 % | |
1 | 0 % |