
Descrição
Visão Geral
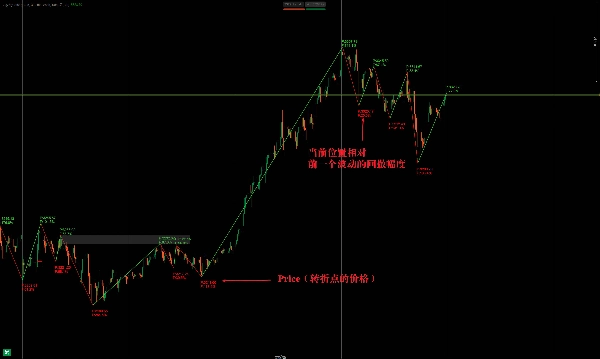
O indicador ZigZag é uma ferramenta de análise técnica usada principalmente para identificar pontos-chave de reversão de preço filtrando o ruído do mercado. Ele conecta máximas e mínimas significativas com linhas ZigZag, ajudando os traders a visualizar tendências e potenciais rompimentos.
Como o ZigZag Funciona
- Funcionalidade Principal
-
- Elimina pequenas flutuações de preço definindo um limite mínimo de variação de preço (percentual ou valor fixo).
- Conecta apenas máximas/mínimas relevantes, simplificando a análise de tendência.
- Frequentemente usado para detectar níveis de suporte/resistência, reversões (ex.: cabeça e ombros, topos/fundos duplos).
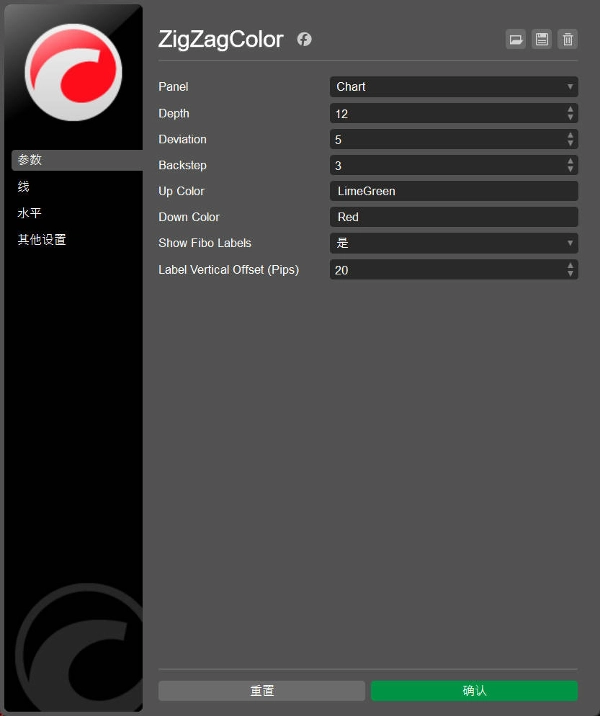
- Parâmetros Chave
-
- Movimento Mínimo de Preço (%): Determina a sensibilidade (ex.: 5% ignora movimentos menores que isso).
- Profundidade de Retrospectiva: Controla quantos candles passados são analisados, afetando o atraso.
Aplicações Principais
1. Identificação de Tendência
- Tendências de Alta: Máximas mais altas (HH) + mínimas mais altas (HL).
- Tendências de Baixa: Máximas mais baixas (LH) + mínimas mais baixas (LL).
- Ajuda a traçar linhas de tendência para possíveis operações de rompimento.
2. Reconhecimento de Padrões
- Revela padrões clássicos de gráfico (triângulos, bandeiras, cunhas) definindo pontos de oscilação.
3. Níveis de Retração de Fibonacci
- Marca máximas/mínimas claras para extensões ou retracements de Fibonacci.
4. Detecção de Divergência
- Destaca divergências entre preço e osciladores (RSI, MACD).
O indicador ZigZag é uma ferramenta de análise técnica usada principalmente para identificar pontos-chave de reversão de preço, ajudando os traders a filtrar o ruído do mercado e destacar máximas e mínimas importantes. A seguir estão seus pontos principais e usos:
Princípio do Indicador ZigZag
- Função Básica:
-
- Ignora automaticamente pequenas flutuações definindo um limite de variação de preço (percentual ou valor fixo), conectando apenas máximas e mínimas significativas para formar linhas ZigZag.
- Frequentemente usado para ajudar a identificar níveis de suporte/resistência e reversões de tendência (como ombro-cabeça-ombro, fundos duplos, etc.).
- Parâmetros Principais:
-
- Amplitude Mínima de Oscilação (ex.: 5% ou pontos): determina a sensibilidade para filtrar pequenas oscilações. Quanto maior o valor, menos sinais, porém mais confiáveis.
- Profundidade de Retrospectiva: controla a quantidade de candles considerados no cálculo, afetando o atraso na identificação dos pontos de reversão.
Principais Usos
- Identificação de Tendência:
-
- Determina a direção da tendência por meio de máximas ascendentes (tendência de alta) ou mínimas descendentes (tendência de baixa).
- Combinado com linhas de tendência, pode antecipar rompimentos ou retrações.
- Análise de Padrões:
-
- Identifica padrões clássicos de preço (como triângulos, bandeiras), com as linhas ZigZag mostrando claramente os limites dos padrões.
- Uso com Ferramentas de Fibonacci:
-
- Usa os pontos altos/baixos marcados pelo ZigZag como pontos de partida/fim para retrações ou extensões de Fibonacci.
- Detecção de Divergência:
-
- Quando há divergência entre preço e indicadores (como RSI, MACD), o ZigZag ajuda a confirmar os pontos inicial e final da divergência.


