
Descrição
A suíte definitiva de candlestick está aqui para ajudá-lo a detectar a maioria dos padrões de candlestick que existem hoje.
Padrões de candlestick, que são ferramentas técnicas de negociação, têm sido usados por séculos para prever a direção do preço. Existem vários padrões de candlestick usados para determinar a direção e o momentum do preço, incluindo three line strike, two red gapping, three red crows, evening star e abandoned baby.
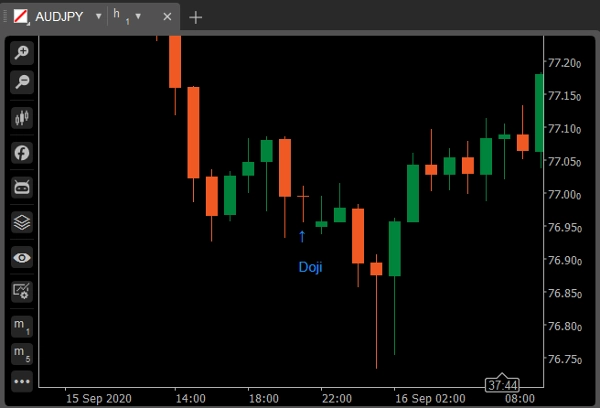
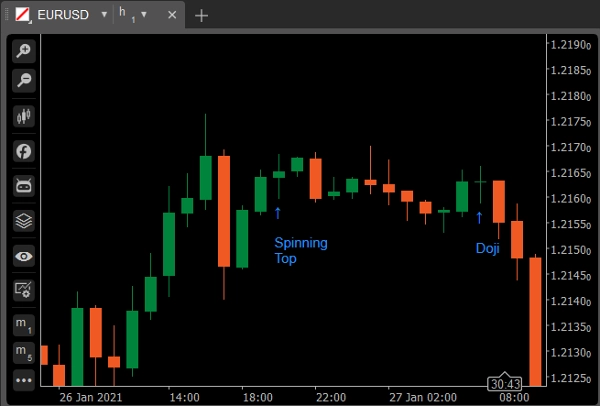
Doji
Um candlestick doji se forma quando a abertura e o fechamento de um ativo são praticamente iguais para o período de tempo dado e geralmente sinaliza um padrão de reversão para analistas técnicos. O limite do corpo é no máximo 5% do comprimento total.
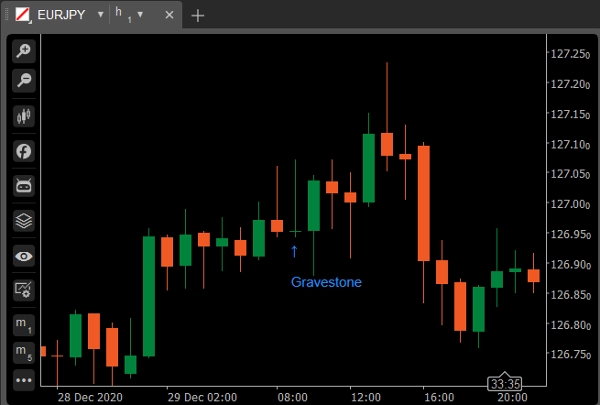
Variação: Gravestone Doji
É formado quando os preços máximo, abertura e fechamento do ativo são (quase) os mesmos. A longa sombra inferior sugere que houve uma venda agressiva durante o período da vela, mas como o preço fechou próximo à abertura, mostra que os compradores conseguiram absorver a venda e empurrar o preço para cima novamente.
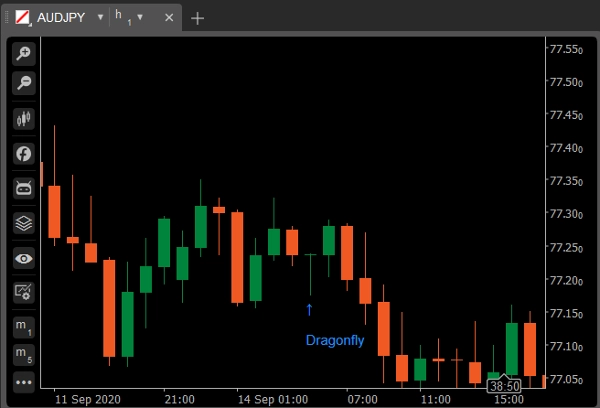
Variação: Dragonfly Doji
Um gravestone doji ocorre quando os preços mínimo, abertura e fechamento são (quase) os mesmos, e a vela tem uma longa sombra superior. O gravestone parece um "T" invertido. As implicações para o gravestone são as mesmas do dragonfly. Ambos indicam possíveis reversões de tendência, mas devem ser confirmados pela vela que segue.
Spinning Top
Um spinning top é um padrão de candlestick com um corpo real curto que está verticalmente centrado entre longas sombras superior e inferior. O padrão de candlestick representa indecisão sobre a direção futura do ativo. Nem os compradores nem os vendedores conseguiram ganhar vantagem. O limite do corpo é no máximo 20% do comprimento total.
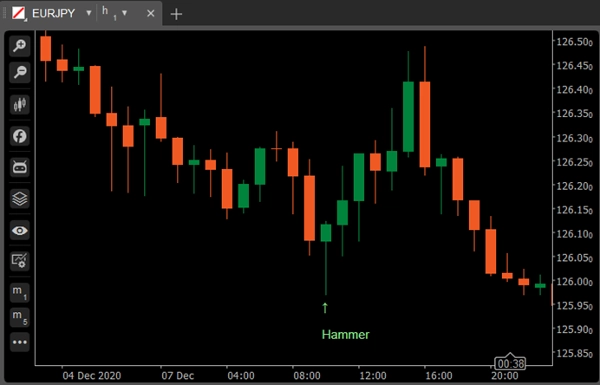
Hammer
Hammer Um candlestick verde ou vermelho que consiste em um corpo pequeno perto do topo com pouca ou nenhuma sombra superior e uma longa cauda inferior. Considerado um padrão de alta durante uma tendência de baixa.
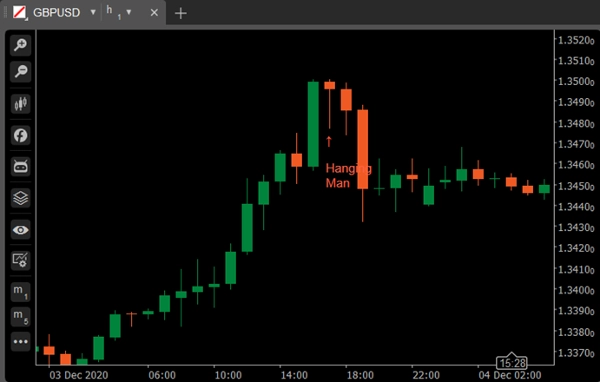
Variação: Hanging Man
Um candlestick verde ou vermelho que consiste em um corpo pequeno perto do topo com pouca ou nenhuma sombra superior e uma longa cauda inferior. Considerado um padrão de baixa durante uma tendência de alta.
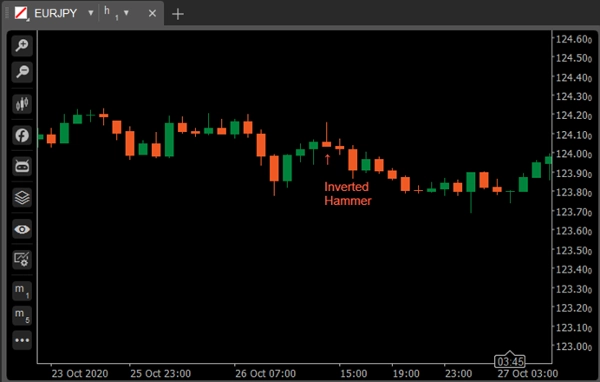
Inverted Hammer
O inverted hammer é um tipo de padrão de candlestick encontrado após uma tendência de baixa e geralmente é considerado um sinal de reversão de tendência.
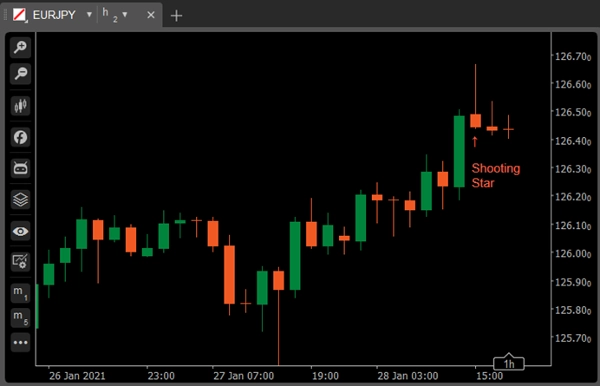
Variação: Shooting Star
O Shooting Star parece exatamente igual ao Inverted hammer, mas em vez de ser encontrado em uma tendência de baixa, é encontrado em uma tendência de alta e, portanto, tem implicações diferentes.
Marubozu
Um candlestick longo ou normal (vermelho ou verde) sem sombra ou cauda. O máximo e o mínimo representam os preços de abertura e fechamento. Considerado um padrão de continuação.
Variação: Marubozu Open
Quanto ao Marubozu open, o preço de abertura deve ser plano: ou seja, a ação do preço deve se mover apenas em uma direção, mas ao contrário do Marubozu full candle, o preço de fechamento do outro lado pode diferir ligeiramente do máximo/mínimo. Em outras palavras, a abertura deve ser plana, enquanto há espaço para um pequeno pavio do outro lado.
Variação: Marubozu Close
A vela Marubozu close é o oposto do Marubozu open: o fechamento deve ser plano enquanto a ação do preço pode se mover ligeiramente na outra direção antes de começar a negociar agressivamente em uma direção.
Bullish Engulfing
Consiste em um corpo vermelho menor que está contido dentro do seguinte grande candlestick verde. Quando aparece na parte inferior, é interpretado como um sinal de reversão importante.
Bearish Engulfing
Consiste em um corpo verde menor que está contido dentro do seguinte grande candlestick vermelho. Quando aparece no topo, é considerado um sinal de reversão importante.
Piercing Line
Piercing Line consiste em um candlestick vermelho seguido por um candlestick verde que abre abaixo do mínimo do anterior, mas fecha mais da metade dentro do corpo do candlestick vermelho. É considerado um sinal de reversão quando aparece na parte inferior.
Dark Shadow Cover
Consiste em um longo candlestick verde seguido por um candlestick vermelho que abre acima do máximo do candlestick verde e fecha bem dentro do corpo do candlestick verde. É considerado um sinal de reversão de baixa durante uma tendência de alta.
Bullish Harami
Consiste em um corpo vermelho incomumente grande seguido por um corpo verde pequeno (contido dentro do corpo vermelho grande). É considerado um padrão de alta quando precedido por uma tendência de baixa.
Variação: Bullish Harami Cross
Um corpo vermelho grande seguido por um Doji. É considerado um sinal de reversão quando aparece na parte inferior.
Bearish Harami
Bearish Harami consiste em um corpo verde incomumente grande seguido por um corpo vermelho pequeno (contido dentro de um corpo verde grande). É considerado um padrão de baixa quando precedido por uma tendência de alta.
Variação: Bearish Harami Cross
Um corpo verde grande seguido por um Doji. Considerado um sinal de reversão quando aparece no topo.
Bullish/Bearish Kicker
O sinal Bullish Kicker geralmente ocorre após uma grande surpresa nas notícias que é anunciada antes ou depois do horário de mercado. Algo drástico aconteceu, causando uma grande mudança no sentimento dos investidores, e uma reversão inevitavelmente seguirá. Quanto maior o gap entre as duas velas, mais significativo é o sinal.
Morning/Evening Star
Consiste em um candlestick de corpo verde grande seguido por um candlestick de corpo pequeno (vermelho ou verde) que abre acima do anterior. O terceiro é um candlestick de corpo vermelho que fecha bem dentro do corpo verde grande. É considerado um sinal de reversão quando aparece no nível superior.
Variação: Abandoned Baby
Three Green Soldiers/Three Red Crows
Consiste em três candlesticks verdes longos com fechamentos consecutivamente mais altos. Os preços de fechamento estão próximos ou nos seus máximos. Quando aparece na parte inferior, é interpretado como um sinal de reversão de fundo.
Consiste em três candlesticks vermelhos longos com fechamentos consecutivamente mais baixos. Os preços de fechamento estão próximos ou nos seus mínimos. Quando aparece no topo, é considerado um sinal de reversão de topo.
Three Line Strike
Um three line strike é um grupo de continuação de candlesticks que tem três na direção de uma tendência seguidos por uma vela final que recua até o ponto inicial. Os traders usam o three line strike como uma oportunidade para comprar em uma baixa recente da tendência ou vender em uma alta recente.
Two Red Gapping
O padrão de continuação bearish two red gapping aparece após um topo notável em uma tendência de alta, com um gap para baixo que resulta em duas barras vermelhas com mínimas mais baixas. Este padrão prevê que a queda continuará até mínimas ainda mais baixas.
Resumo
Avaliações de clientes
5 | 100 % | |
4 | 0 % | |
3 | 0 % | |
2 | 0 % | |
1 | 0 % |


