
คำอธิบาย
บทนำสู่ ADX
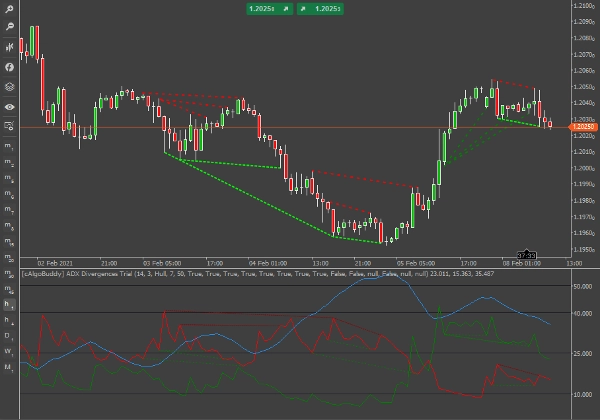
ADX (เส้นสีน้ำเงิน) ถูกวางกราฟเป็นเส้นเดียวโดยมีค่าตั้งแต่ต่ำสุดที่ศูนย์จนถึงสูงสุดที่ 100 ADX เป็น ไม่ชี้ทิศทาง; มันบันทึกความแข็งแกร่งของแนวโน้มไม่ว่าราคาจะเคลื่อนไหวขึ้นหรือลง ตัวชี้วัดนี้มักจะถูกวางกราฟในหน้าต่างเดียวกับเส้นตัวชี้วัดการเคลื่อนไหวทิศทางสองเส้น (Di+ และ Di-) ซึ่ง ADX ได้มาจากเส้นเหล่านี้
ตัวชี้วัดนี้ตรวจจับความแตกต่างบนเส้น Di+ และ Di- แตกต่างจากตัวชี้วัดอื่นที่ตรวจจับความแตกต่าง ด้วยตัวนี้เราสามารถดึงข้อมูลที่มีค่ามากขึ้นจากอีกสองส่วนที่เกี่ยวข้องกับสัญญาณความแตกต่างได้ เช่น หากเกิดความแตกต่างบน Di+ เราสามารถประเมินสัญญาณโดยคำนึงถึงระดับของ Di- และ ADX
เส้น Di+ และ Di- ถูกปรับความเรียบบางส่วนด้วยค่าเฉลี่ยเคลื่อนที่ Hull ในช่วง 3 งวด สำหรับความแตกต่างที่สมบูรณ์ 100% คุณสามารถตั้งค่าระยะ MA เป็น 1 และประเภทค่าเฉลี่ยเคลื่อนที่เป็นแบบง่าย อย่างไรก็ตาม เนื่องจากเราวาดความแตกต่างบนสองเส้นในหน้าต่างตัวชี้วัดเดียวกัน บางครั้งคุณอาจรู้สึกว่ามีสัญญาณมากเกินไป ในทางกลับกัน คุณสามารถเลือกจากการตั้งค่าตัวชี้วัดได้ว่าอยากเห็นความแตกต่างประเภทใดและสำหรับเส้นใด (Di+ หรือ Di-)
สัญญาณความแตกต่างจะถือว่าได้รับการยืนยันเมื่อเปิดแท่งถัดไปหลังจากเกิดความแตกต่าง อย่างไรก็ตาม เนื่องจากลักษณะที่ “ไม่ยืดหยุ่น” ของเส้นแนวโน้ม ADX (เมื่อเทียบกับเช่น RSI) เมื่อเส้นความแตกต่างปรากฏขึ้น มันจะอยู่ที่นั่นจนถึงแท่งยืนยัน เว้นแต่จะเกิดความผันผวนรุนแรง
ก่อนเทรดสัญญาณความแตกต่างใด ๆ ให้ระบุสิ่งต่อไปนี้:
- ทิศทางและระดับของ ADX
- ระยะห่างระหว่าง Di+ และ Di-
- ทิศทางและระดับของ Di+
- ทิศทางและระดับของ Di-
นอกจากนี้ โปรดจำไว้
- หลีกเลี่ยงการเทรดความแตกต่างใด ๆ เมื่อ ADX ต่ำ (ต่ำกว่า 15 และแนวโน้มกำลังลดลง) เนื่องจากสัญญาณควรใช้ตามแนวโน้มที่พัฒนาแล้วหรือกำลังพัฒนา
- นอกจากนี้ โปรดจำไว้ว่า การตัดกันของ Di+ และ Di- ถือเป็นสัญญาณกระทิง/หมีในตัวเอง ดังนั้นให้ปรับตำแหน่งของคุณตามนั้น
- ในกรณีที่ทั้ง Di+ และ Di- เกิดความแตกต่างในแท่งเดียวกัน ให้เลือกเส้นที่เหมาะสมขึ้นอยู่กับแนวโน้ม (แนวโน้มกระทิง/สัญญาณกระทิง Di+, แนวโน้มหมี/สัญญาณหมี Di-)
- คุณไม่จำเป็นต้องเทรดทุกสัญญาณ
ความแตกต่างบน DiPlus
DiPlus (สีเขียว) คือเส้นที่แสดง ความแข็งแกร่งของแนวโน้มกระทิง เราสามารถตรวจจับความแตกต่างระหว่างความแข็งแกร่งของแนวโน้มกระทิงในลักษณะคล้ายกับออสซิลเลเตอร์ส่วนใหญ่
ความแตกต่างกระทิงปกติ
คำนิยาม: ราคาทำจุดต่ำสุดต่ำลงแต่ตัวชี้วัดทำจุดต่ำสุดสูงขึ้น ผลลัพธ์ที่เหมาะสมคือ: หลังจากการกระตุกกระทิงเล็กน้อย เราควรเห็นแนวโน้มหมีพัฒนา วาดด้วยเส้นประสีเขียวอ่อนในหน้าต่างราคาและตัวชี้วัด
แนวโน้มหมีที่โดดเด่นซึ่งกำลังเริ่มพัฒนาหรือพัฒนาแล้ว เราจะเปิดสถานะสั้นหลังจากการแก้ไขเล็กน้อยเกิดขึ้น ในบางกรณี ความแตกต่างบน Di+ อาจเกิดขึ้นบนแท่งหมี ซึ่งเป็นการยืนยันที่ดีของแนวโน้มหมีที่โดดเด่น
บางครั้ง การกระตุกกระทิงจะพัฒนาเป็นแนวโน้มกระทิง ซึ่งอาจเกิดขึ้นเมื่อไม่มีแนวโน้มหรือมีน้อย (Di+ และ Di- อยู่ใกล้กัน, ADX< 20) หรือหลังจากแนวโน้มหมีหมดแรงที่ระดับแนวต้าน
ความแตกต่างกระทิงซ่อนเร้น
คำนิยาม: ราคาทำจุดต่ำสุดสูงขึ้นและตัวชี้วัดทำจุดต่ำสุดต่ำลง เราควรคาดหวังการพัฒนาแนวโน้มกระทิงหรือการดำเนินต่อ วาดด้วยเส้นประสีเขียวเข้มบางส่วนในหน้าต่างราคาและตัวชี้วัด
แนวโน้มกระทิงที่โดดเด่นซึ่งกำลังเริ่มพัฒนาหรือพัฒนาแล้ว เราจะเปิดสถานะยาวหลังจากการแก้ไขเล็กน้อยเกิดขึ้น จุดหยุดขาดทุนควรวางไว้รอบ ๆ จุดต่ำของแท่งความแตกต่าง
เป็นหนึ่งในสัญญาณที่ดีกว่าของตัวชี้วัดนี้ โดยเฉพาะเพราะเราคาดหวังการดำเนินแนวโน้มทันทีและสามารถรักษาจุดหยุดขาดทุนให้น้อยที่สุด
ความแตกต่างหมีปกติ
คำนิยาม: ราคาทำจุดสูงสุดสูงขึ้นแต่ตัวชี้วัดทำจุดสูงสุดต่ำลง หลังจากการลดลงเล็กน้อยของแนวโนมหมี เราควรเห็นแนวโน้มกระทิงพัฒนา วาดด้วยเส้นประสีแดงเข้มในหน้าต่างราคาและตัวชี้วัด
แนวโน้มกระทิงที่โดดเด่นยังคงเพิ่มขึ้น (ADX ยังคงเพิ่มขึ้นในช่วงเวลาความแตกต่าง)
สถานการณ์สำหรับเหตุการณ์นี้เกิดขึ้น น้อยมาก เนื่องจาก Di+ แสดงถึงความแข็งแกร่งของกระทิง โดยปกติสถานการณ์นี้จะเกิดขึ้นหลังจากแนวโน้มกระทิงหมดแรง ซึ่งหมายความว่านี่คือ “จุดสูงสุด” สุดท้ายก่อนที่แนวโนมหมีจะเริ่มพัฒนา ดังนั้นส่วนใหญ่จึงแนะนำให้เปิดสถานะสั้นตามสัญญาณนี้
ความแตกต่างหมีซ่อนเร้น
คำนิยาม: ราคาทำจุดสูงสุดต่ำลงและตัวชี้วัดทำจุดสูงสุดสูงขึ้น เราควรคาดหวังการดำเนินแนวโนมหมี วาดด้วยเส้นประสีแดงบางส่วนในหน้าต่างราคาและตัวชี้วัด
แนวโนมหมีที่โดดเด่นพร้อมกับการกระตุกของกระทิง (ADX ยังคงเพิ่มขึ้นในช่วงเวลาความแตกต่าง)
การคาดหวังการดำเนินแนวโนมหมีจากเส้นแนวโน้มกระทิงเป็นสิ่งที่ขัดแย้ง นี่คือเหตุผลที่สัญญาณนี้ควรใช้ด้วยความระมัดระวัง ตลาดมักจะเข้าสู่ช่วงรวมตัวหลังจากความแตกต่างนี้
ในตลาดที่ไม่มีแนวโน้ม ให้หลีกเลี่ยงการเทรด ในแนวโนมหมีที่หมดแรง หากคุณเลือกเปิดสถานะสั้น ให้ทำการเทรดแบบสั้น ๆ
ความแตกต่างบน DiMinus
DiMinus (สีแดง) คือเส้นที่แสดง ความแข็งแกร่งของแนวโนมหมี วิธีที่เราตรวจจับความแตกต่างบนราคาและ DiMinus นั้นเป็นการย้อนกลับของวิธีที่เราตรวจจับความแตกต่างบน DiPlus
ความแตกต่างกระทิงปกติ
คำนิยาม: ราคาทำจุดต่ำสุดต่ำลงแต่ตัวชี้วัดทำจุดสูงสุดต่ำลง (แทนที่จะเป็นจุดต่ำสุดสูงขึ้น) หลังจากการกระตุกกระทิงเล็กน้อย เราควรเห็นแนวโนมหมีพัฒนา วาดด้วยเส้นประสีเขียวอ่อนในหน้าต่างราคาและเส้นประสีแดงเข้มในหน้าต่างตัวชี้วัด
แนวโนมหมีที่โดดเด่นซึ่งกำลังเริ่มพัฒนาหรือพัฒนาแล้ว เราจะเปิดสถานะสั้นหลังจากการแก้ไขเล็กน้อยเกิดขึ้น ในบางกรณี ความแตกต่างบน Di- อาจเกิดขึ้นบนแท่งหมี ซึ่งเป็นการยืนยันที่ดีของแนวโนมหมีที่โดดเด่น
เช่นเดียวกับสัญญาณที่มาจาก Di+ บางครั้งการกระตุกหมีจะพัฒนาเป็นแนวโนมหมี ซึ่งอาจเกิดขึ้นเมื่อไม่มีแนวโน้มหรือมีน้อย (Di+ และ Di- อยู่ใกล้กัน, ADX< 20) หรือหลังจากแนวโน้มกระทิงหมดแรงที่ระดับแนวต้าน
ความแตกต่างกระทิงซ่อนเร้น
คำนิยาม: ราคาทำจุดต่ำสุดสูงขึ้นและตัวชี้วัดทำจุดสูงสุดสูงขึ้น (แทนที่จะเป็นจุดต่ำสุดต่ำลง) เราควรคาดหวังการดำเนินแนวโน้มกระทิง วาดด้วยเส้นประสีเขียวบางส่วนในหน้าต่างราคาและเส้นประสีแดงเข้มบางส่วนในหน้าต่างตัวชี้วัด
เป็นสิ่งที่ขัดแย้งที่จะคาดหวังการดำเนินแนวโน้มกระทิงจากเส้นแนวโน้ม Di- เราจำเป็นต้องมีการกระตุกหมีในแนวโน้มกระทิง
ความแตกต่างหมีปกติ
คำนิยาม: ราคาทำจุดสูงสุดสูงขึ้นแต่ตัวชี้วัดทำจุดต่ำสุดสูงขึ้น (แทนที่จะเป็นจุดสูงสุดต่ำลง) หลังจากการลดลงของราคา เราควรเห็นการดำเนินแนวโน้มกระทิง วาดด้วยเส้นประสีแดงเข้มในหน้าต่างราคาและเส้นประสีเขียวอ่อนในหน้าต่างตัวชี้วัด
แนะนำให้เปิดสถานะยาวในแนวโน้มกระทิงที่แข็งแกร่งและกำลังพัฒนา แต่ในตลาดกระทิงที่หมดแรงและอ่อนตัว ให้เปิดสถานะสั้น
ความแตกต่างหมีซ่อนเร้น
ราคาทำจุดสูงสุดต่ำลงและตัวชี้วัดทำจุดต่ำสุดต่ำลง (แทนที่จะเป็นจุดสูงสุดสูงขึ้น) เราควรคาดหวังการดำเนินแนวโนมหมี วาดด้วยเส้นประสีแดงบางส่วนในหน้าต่างราคาและเส้นประสีเขียวบางส่วนในหน้าต่างตัวชี้วัด
เป็นหนึ่งในสัญญาณที่ดีกว่าของตัวชี้วัดนี้ โดยเฉพาะเพราะเราคาดหวังการดำเนินแนวโนมหมีทันทีและสามารถรักษาจุดหยุดขาดทุนให้น้อยที่สุด จุดหยุดขาดทุนควรวางไว้ที่จุดต่ำของแท่งความแตกต่าง
การแจ้งเตือนข้อความทันทีผ่าน Telegram
หากคุณมีบอทและช่องใน Telegram ตั้งค่าไว้ ตัวชี้วัด ADX Divergences จะส่งข้อความแจ้งเตือนสำหรับสัญญาณที่ได้รับการยืนยันบนคู่สกุลเงินที่คุณใช้งาน โปรดทราบว่าคุณจะได้รับสัญญาณเฉพาะสำหรับสิ่งที่คุณเลือก "ใช่" เพื่อแสดงผล คุณสามารถตั้งค่าหุ่นยนต์เทรดนี้ให้ส่งการแจ้งเตือน Telegram ทันทีไปยังพีซี แท็บเล็ต หรือโทรศัพท์มือถือของคุณได้ด้วย
สำคัญ: โปรดตรวจสอบให้แน่ใจว่าโซนเวลาของคุณถูกตั้งค่าให้ตรงกับเวลาท้องถิ่นของคุณอย่างถูกต้อง (มุมล่างขวาของแอปพลิเคชัน)
การแจ้งเตือนบนเดสก์ท็อป
หากคุณเลือกใช่ ตัวชี้วัด ADX Divergences จะส่งการแจ้งเตือนกล่องข้อความบนเดสก์ท็อปส่วนตัวของคุณสำหรับสัญญาณที่ได้รับการยืนยัน
การแจ้งเตือนทางอีเมล
สำหรับฟังก์ชันนี้จะทำงานได้ คุณต้องตั้งค่า cTrader ของคุณให้สามารถส่งอีเมลได้ก่อน (การตั้งค่า-> อีเมล) หากคุณเลือกใช่ ตัวชี้วัด ADX Divergences จะส่งอีเมลแจ้งเตือนสำหรับสัญญาณที่ได้รับการยืนยันไปยังที่อยู่อีเมลที่คุณป้อน
สรุป
This indicator detects divergences on both Di+ and Di- lines, allowing traders to analyze signals with additional context from the other directional lines and ADX levels. The Di+ and Di- lines are smoothed using a Hull moving average, adjustable via settings to control signal sensitivity and display preferences.
Divergence signals are confirmed at the opening of the bar following the divergence, with guidance provided on interpreting various divergence types—regular and hidden bullish and bearish divergences—on both Di+ and Di- lines. Users are advised to consider ADX levels, the distance between Di+ and Di-, and the direction and level of each line before trading signals.
The indicator supports instant alerts via Telegram messages, desktop notifications, and email, configurable within the platform. Proper time zone settings are required for accurate alert timing. This tool is applicable across multiple markets including Forex, commodities, indices, stocks, and cryptocurrencies such as BTCUSD and XAUUSD.
รีวิวจากลูกค้า
5 | 100 % | |
4 | 0 % | |
3 | 0 % | |
2 | 0 % | |
1 | 0 % |


