
คำอธิบาย
วัตถุประสงค์ของอัลกอริทึม cTrader ของตัวบ่งชี้ Boxify นี้คือการพยายามจัดการเคลื่อนไหวของราคาให้อยู่ในโซน หรือที่ดีกว่าคือ กล่อง ด้วยวิธีนี้ เทรดเดอร์จะสามารถได้เปรียบในการวางตำแหน่งการเทรดของเขา นี่ไม่ใช่ตัวบ่งชี้ที่สามารถใช้งานได้ด้วยตัวเอง แต่เป็นเครื่องมือที่ดีที่สามารถเสริมกลยุทธ์หรือการตั้งค่าการเทรดใด ๆ ได้
การตรวจจับการเคลื่อนไหวแบบด้านข้างสามารถช่วยให้เทรดเดอร์รักษากำไร ลดการขาดทุน หรือวางคำสั่งจำกัดในทางที่เป็นประโยชน์สำหรับเขา นี่คือวิธีการบางอย่างที่เราสามารถใช้กล่องได้:
ตรวจจับพื้นที่รวมตัว
สำหรับกล่องในอดีตที่มีแท่งเทียนหลายแท่งอยู่ภายใน เราสามารถสันนิษฐานได้อย่างปลอดภัยว่านี่คือพื้นที่รวมตัวและมีการเคลื่อนไหวแบบด้านข้าง พื้นที่เหล่านี้สามารถทำหน้าที่เป็นระดับแนวรับหรือแนวต้านในการวิเคราะห์การเคลื่อนไหวของราคาของคุณ
วางการเทรดของคุณให้ดีขึ้น
ในกรณีที่คุณมีการตั้งค่าการเทรดและคุณเห็นราคากำลังอยู่ในกล่อง คุณสามารถใช้กล่องเป็นแนวทางสำหรับการเคลื่อนไหวของราคา เพื่อให้ได้ตำแหน่งที่เป็นประโยชน์มากขึ้นสำหรับการเทรดของคุณ กล่องที่กำลังสร้างขึ้นในขณะนี้สามารถใช้เพื่อรักษากำไรในตำแหน่งที่ชนะ เข้าสู่ตลาดที่มีแนวโน้มอีกครั้ง หรือวางจุดหยุดขาดทุน
วางคำสั่งจำกัด
การเคลื่อนไหวแบบด้านข้างที่ยาวนานจะนำไปสู่การเบรคเอาท์ในที่สุด Boxify สามารถช่วยคุณวางคำสั่งจำกัด เหนือหรือใต้ เพื่อให้ได้ประโยชน์สูงสุดจากการเริ่มต้นเบรคเอาท์
ตัวเลือกของตัวบ่งชี้
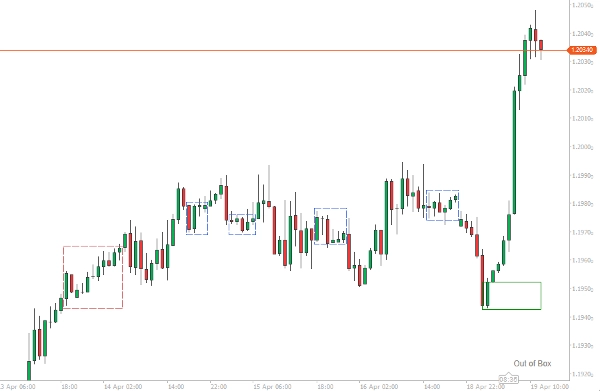
ตัวบ่งชี้จะพยายามจัดกล่องราคาจากแท่งเทียนอย่างน้อย 2 แท่งขึ้นไป ข้อความจากตัวบ่งชี้จะแสดงที่มุมล่างขวาของพื้นที่แผนภูมิ
- ถ้าราคากำลังมีแนวโน้ม ข้อความ “Out of Box” จะปรากฏ
- ถ้าราคากำลังอยู่ในกล่อง ข้อความ “Boxing” จะปรากฏ
- ถ้าราคากำลังอยู่ในกล่องและราคาทะลุขอบบน ข้อความ “Breaking High” จะปรากฏ
- ถ้าราคากำลังอยู่ในกล่องและราคาทะลุขอบล่าง ข้อความ “Breaking Low” จะปรากฏ
กล่องจะถือว่าสมบูรณ์เมื่อเปิดแท่งเทียนใหม่ เนื่องจากราคาสามารถกลับเข้ามาในกล่องได้เสมอ
จำนวนแท่งเทียนขั้นต่ำสำหรับกล่อง
ตัวเลขนี้แสดงจำนวนแท่งเทียนขั้นต่ำที่กล่องต้องมีเพื่อถือว่าสมบูรณ์ ใช้ตัวเลขต่ำสำหรับจุดเข้า และตัวเลขสูงสำหรับพื้นที่รวมตัว
ตัวกรอง ATR
Boxify มีตัวบ่งชี้ ATR ภายในที่คุณสามารถใช้เป็นตัวเลือกการกรอง หากคุณต้องการหยุดการสร้างกล่องบนแท่งเทียนใด ๆ ที่ความยาว (สูง-ต่ำ) ของมันทะลุค่าของ ATR ใช้ตัวเลือกนี้หากคุณต้องการเข้าทำการเทรด
รวมการทับซ้อน
จุดเริ่มต้นของกล่องสามารถเริ่มก่อนที่กล่องก่อนหน้าจะสิ้นสุด (โดยเฉพาะถ้าเราเลือกจำนวนแท่งเทียนสำหรับความยาวกล่องต่ำมาก) เราสามารถรวมกล่องเหล่านี้ด้วยตัวเลือกนี้ เพื่อให้เราเห็นกล่องที่ใหญ่ขึ้นกำลังสร้างขึ้น – กล่องเหล่านี้จะมีเส้นขอบสีฟ้า
ความทนทาน
ตัวเลขที่สะท้อนความทนทานที่ขอบบน/ล่างของกล่องสามารถมีได้ ควรใช้ตัวเลขเล็กเมื่อเราต้องการเข้าทำการเทรด และใช้ตัวเลขใหญ่เมื่อเราต้องการหาพื้นที่รวมตัว
สรุป
รีวิวจากลูกค้า
5 | 33 % | |
4 | 67 % | |
3 | 0 % | |
2 | 0 % | |
1 | 0 % |


