
Açıklama
ADX'ye Giriş
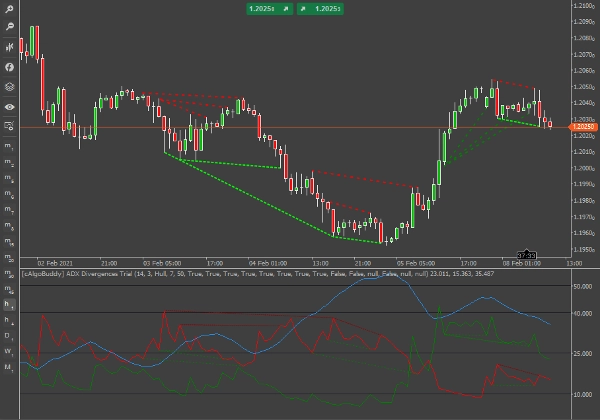
ADX (mavi çizgi) sıfırdan 100'e kadar değişen değerlerle tek bir çizgi olarak çizilir. ADX yönsüzdür; fiyat yukarı mı yoksa aşağı mı hareket ediyor olursa olsun trend gücünü kaydeder. Gösterge genellikle ADX'in türetildiği iki yönlü hareket göstergesi (Di+ ve Di-) çizgileri ile aynı pencerede çizilir.
Bu gösterge, Di+ ve Di- çizgilerindeki uyumsuzlukları tespit eder. Uyumsuzlukları tespit eden diğer göstergelerin aksine, bu gösterge ile bir uyumsuzluk sinyalinin diğer 2 karşıtından daha değerli bilgiler çıkarabiliriz. Örneğin, bir uyumsuzluk Di+ üzerinde gerçekleşirse, sinyali Di- ve ADX seviyelerini dikkate alarak değerlendirebiliriz.
Di+ ve Di- çizgileri kısmen 3 periyotluk Hull hareketli ortalaması ile düzeltilmiştir. %100 uyumsuzluk çılgınlığı için MA periyodunu 1 ve hareketli ortalama türünü Basit olarak ayarlayabilirsiniz. Ancak, aynı gösterge penceresinde 2 çizgi üzerinde uyumsuzluklar çizdiğimiz için bazen sinyaller sizi bunaltabilir. Öte yandan, gösterge ayarlarından hangi tür uyumsuzlukları ve hangi çizgi (Di+ veya Di-) için görmek istediğinizi tam olarak seçebilirsiniz.
Bir uyumsuzluk sinyali, uyumsuzluğu takip eden barın açılışında onaylanmış sayılır. Ancak, ADX trend çizgilerinin “esnek olmayan” doğası nedeniyle (örneğin RSI ile karşılaştırıldığında) bir uyumsuzluk çizgisi göründüğünde, aşırı volatilite olmadıkça onay barına kadar orada kalacaktır.
Herhangi bir uyumsuzluk sinyalinde işlem yapmadan önce aşağıdakileri belirleyin:
- ADX'in yönü ve seviyesi
- Di+ ile Di- arasındaki mesafe
- Di+'nın yönü ve seviyesi
- Di-'nın yönü ve seviyesi
Ayrıca, aklınızda bulundurun
- ADX düşük olduğunda (15'in altında ve düşen trend) herhangi bir uyumsuzluk işlemi yapmaktan kaçının, çünkü sinyaller zaten gelişmiş veya gelişmekte olan trendlere dayanarak alınmalıdır.
- Ayrıca, Di+ ve Di- kesişiminin kendi başına bir yükseliş/düşüş sinyali olarak kabul edildiğini unutmayın, bu yüzden pozisyonlarınızı buna göre ayarlayın.
- Her iki Di+ ve Di- aynı mum üzerinde uyumsuzluk gösterirse, trende bağlı olarak daha uygun çizgiyi seçin (Yükseliş trendi/yükseliş sinyali Di+, Düşüş trendi/düşüş sinyali Di-).
- Her sinyalde işlem yapmanız gerekmez.
DiPlus Üzerindeki Uyumsuzluklar
DiPlus (Yeşil), yükseliş trendi gücünüçizen çizgidir. Yükseliş trend gücü arasındaki uyumsuzlukları çoğu osilatörle benzer şekilde tespit edebiliriz.
Düzenli Yükseliş Uyumsuzluğu
Tanım: Fiyat daha düşük dip yaptı ancak gösterge daha yüksek dip yaptı. İdeal sonuç: Küçük bir yükselişten sonra düşüş trendi gelişmelidir. Fiyat ve gösterge pencerelerinde noktalı açık yeşil çizgi ile çizilir.
Gelişmekte olan veya zaten gelişmiş baskın bir düşüş trendi. Küçük düzeltme olduktan sonra kısa pozisyona girilir. Bazı durumlarda, Di+ üzerindeki uyumsuzluk düşüş mumunda gerçekleşebilir, bu da baskın düşüş trendinin iyi bir teyididir.
Bazen, yükseliş hareketi bir yükseliş trendi geliştirebilir. Bu, az veya hiç trend olmadığında (Di+ ve Di- birbirine yakın, ADX< 20) veya direnç seviyelerinde düşüş trendi tükenmesinden sonra olabilir.
Gizli Yükseliş Uyumsuzluğu
Tanım: Fiyat daha yüksek dip yaptı ve gösterge daha düşük dip yaptı. Yükseliş trendi gelişimi veya devamı beklenmelidir. Fiyat ve gösterge pencerelerinde kısmen noktalı koyu yeşil çizgi ile çizilir.
Gelişmekte olan veya zaten gelişmiş baskın bir yükseliş trendi. Küçük düzeltme olduktan sonra uzun pozisyona girilir. Stop-loss uyumsuzluk mumunun Düşük seviyesi civarına yerleştirilmelidir.
Bu göstergenin en iyi sinyallerinden biridir, çünkü hemen trend devamı beklenir ve stop-losslarımızı minimumda tutabiliriz.
Düzenli Düşüş Uyumsuzluğu
Tanım: Fiyat daha yüksek tepe yaptı ancak gösterge daha düşük tepe yaptı. Küçük bir düşüşten sonra yükseliş trendi gelişmelidir. Fiyat ve gösterge pencerelerinde noktalı koyu kırmızı çizgi ile çizilir.
Baskın bir yükseliş trendi hala yükseliyor (uyumsuzluk zamanında ADX hala yükseliyor).
Bu senaryonun gerçekleşme koşulları çok nadirdir çünkü Di+ yükseliş gücünü temsil eder. Genellikle, bu koşullar yükseliş trendi tükenmesinden sonra olur, yani düşüş trendinin başlayacağı son “zirve”dir. Bu yüzden çoğu zaman bu sinyalde kısa pozisyona geçmek önerilir.
Gizli Düşüş Uyumsuzluğu
Tanım: Fiyat daha düşük tepe yaptı ve gösterge daha yüksek tepe yaptı. Düşüş trendi devamı beklenmelidir. Fiyat ve gösterge pencerelerinde kısmen noktalı kırmızı çizgi ile çizilir.
Baskın bir düşüş trendi yükseliş sıçramalarıyla (uyumsuzluk zamanında ADX hala yükseliyor).
Yükseliş trend çizgisinden düşüş trendi devamı istemek sezgisel değildir, bu yüzden bu sinyal çok dikkatli alınmalıdır. Genellikle, piyasa bu uyumsuzluktan sonra konsolidasyon aşamasına girer.
Trendsiz bir piyasada işlem yapmaktan kaçının. Tükenmiş bir düşüş trendinde, kısa pozisyona geçerseniz, işlemi hızlı kapatın.
DiMinus Üzerindeki Uyumsuzluklar
DiMinus (Kırmızı), düşüş trendi gücünüçizen çizgidir. Fiyat ve DiMinus üzerindeki uyumsuzlukları tespit etme şeklimiz, DiPlus üzerindeki uyumsuzlukları tespit etme şeklinin bir nevi tersidir.
Düzenli Yükseliş Uyumsuzluğu
Tanım: Fiyat daha düşük dip yaptı ancak gösterge daha düşük tepe yaptı (daha yüksek dip yerine). Küçük bir yükselişten sonra düşüş trendi gelişmelidir. Fiyat penceresinde noktalı açık yeşil çizgi ve gösterge penceresinde noktalı koyu kırmızı çizgi ile çizilir.
Gelişmekte olan veya zaten gelişmiş baskın bir düşüş trendi. Küçük düzeltme olduktan sonra kısa pozisyona girilir. Bazı durumlarda, Di- üzerindeki uyumsuzluk düşüş mumunda gerçekleşebilir, bu da baskın düşüş trendinin iyi bir teyididir.
Di+ karşıtından gelen sinyal gibi, bazen düşüş hareketi bir düşüş trendi geliştirebilir. Bu, az veya hiç trend olmadığında (Di+ ve Di- birbirine yakın, ADX< 20) veya direnç seviyelerinde yükseliş trendi tükenmesinden sonra olabilir.
Gizli Yükseliş Uyumsuzluğu
Tanım: Fiyat daha yüksek dip yaptı ve gösterge daha yüksek tepe yaptı (daha düşük dip yerine). Yükseliş trendi devamı beklenmelidir. Fiyat penceresinde kısmen noktalı yeşil çizgi ve gösterge penceresinde kısmen noktalı koyu kırmızı çizgi ile çizilir.
Di- trend çizgisinden yükseliş trendi devamı istemek sezgisel değildir. Yükseliş trendinde düşüş sıçramaları olmalıdır.
Düzenli Düşüş Uyumsuzluğu
Tanım: Fiyat daha yüksek tepe yaptı ancak gösterge daha yüksek dip yaptı (daha düşük tepe yerine). Fiyatta bir düşüşten sonra yükseliş trendi devamı beklenmelidir. Fiyat penceresinde noktalı koyu kırmızı çizgi ve gösterge penceresinde noktalı açık yeşil çizgi ile çizilir.
Güçlü ve gelişmekte olan bir yükseliş trendinde uzun pozisyona geçmek önerilir. Ancak, tükenmekte olan ve bitmiş bir yükseliş piyasasında kısa pozisyona geçin.
Gizli Düşüş Uyumsuzluğu
Fiyat daha düşük tepe yaptı ve gösterge daha düşük dip yaptı (daha yüksek tepe yerine). Düşüş trendi devamı beklenmelidir. Fiyat penceresinde kısmen noktalı kırmızı çizgi ve gösterge penceresinde kısmen noktalı yeşil çizgi ile çizilir.
Bu göstergenin en iyi sinyallerinden biridir, çünkü hemen düşüş trendi devamı beklenir ve stop-losslarımızı minimumda tutabiliriz. Stop-loss uyumsuzluk mumunun Düşük seviyesine yerleştirilmelidir.
Anlık Telegram Mesaj Uyarıları
Telegram'da bir bot ve kanal kurduğunuz varsayılarak, ADX Uyumsuzlukları göstergesi, çalıştırdığınız döviz çiftinde onaylanmış sinyaller için size mesajlar gönderecektir. Sadece görüntüleme için "Evet" seçtiğiniz sinyaller için bildirim alacağınızı unutmayın. Bu ticaret robotunu, anlık Telegram uyarılarını doğrudan PC, Tablet veya cep telefonunuza gönderecek şekilde yapılandırabilirsiniz.
ÖNEMLİ: Lütfen Saat Diliminizin yerel saatinize doğru ayarlandığından emin olun (uygulamanın sağ alt köşesi).
Masaüstü Uyarıları
Evet'i seçerseniz, ADX Uyumsuzlukları göstergesi onaylanmış sinyaller için kişisel masaüstünüzde bir mesaj kutusu bildirimi gönderir.
E-posta Uyarıları
Bu işlevselliğin çalışması için önce cTrader'ınızı e-posta gönderebilecek şekilde yapılandırmalısınız (Ayarlar-> E-posta). Evet'i seçerseniz, ADX Uyumsuzlukları göstergesi onaylanmış sinyaller için girdiğiniz adrese e-posta gönderir.
Özet
This indicator detects divergences on both Di+ and Di- lines, allowing traders to analyze signals with additional context from the other directional lines and ADX levels. The Di+ and Di- lines are smoothed using a Hull moving average, adjustable via settings to control signal sensitivity and display preferences.
Divergence signals are confirmed at the opening of the bar following the divergence, with guidance provided on interpreting various divergence types—regular and hidden bullish and bearish divergences—on both Di+ and Di- lines. Users are advised to consider ADX levels, the distance between Di+ and Di-, and the direction and level of each line before trading signals.
The indicator supports instant alerts via Telegram messages, desktop notifications, and email, configurable within the platform. Proper time zone settings are required for accurate alert timing. This tool is applicable across multiple markets including Forex, commodities, indices, stocks, and cryptocurrencies such as BTCUSD and XAUUSD.
Müşteri değerlendirmeleri
5 | 100 % | |
4 | 0 % | |
3 | 0 % | |
2 | 0 % | |
1 | 0 % |


