
คำอธิบาย
ชุดแท่งเทียนสุดยอดนี้ถูกสร้างขึ้นเพื่อช่วยให้คุณตรวจจับรูปแบบแท่งเทียนส่วนใหญ่ที่มีอยู่ในปัจจุบัน
รูปแบบแท่งเทียน ซึ่งเป็นเครื่องมือทางเทคนิคในการซื้อขาย ถูกใช้มาหลายศตวรรษเพื่อทำนายทิศทางราคา มีรูปแบบแท่งเทียนต่างๆ ที่ใช้กำหนดทิศทางราคาและโมเมนตัม รวมถึง three line strike, two red gapping, three red crows, evening star และ abandoned baby
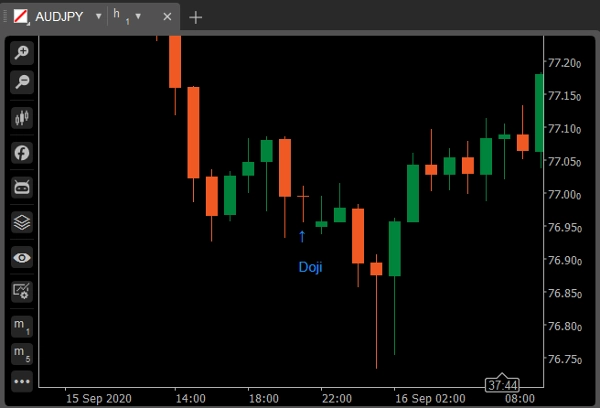
โดจิ
แท่งเทียนโดจิจะเกิดขึ้นเมื่อราคาปิดและราคาเปิดของหลักทรัพย์แทบจะเท่ากันในช่วงเวลาที่กำหนด และโดยทั่วไปจะเป็นสัญญาณของรูปแบบกลับตัวสำหรับนักวิเคราะห์ทางเทคนิค ขนาดของตัวแท่งมีขีดจำกัดสูงสุดที่ 5% ของความยาวทั้งหมด
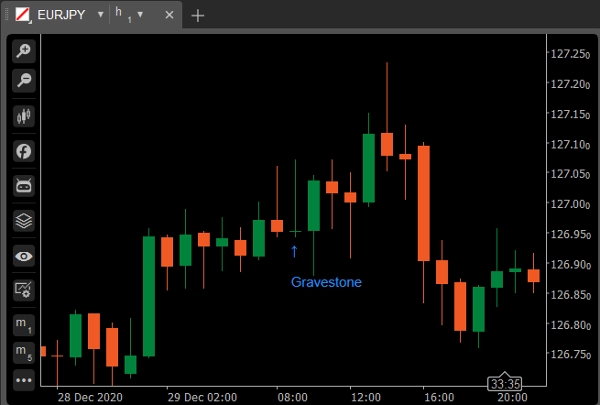
รูปแบบย่อย: Gravestone Doji
เกิดขึ้นเมื่อราคาสูงสุด ราคาเปิด และราคาปิดของสินทรัพย์ (เกือบ) เท่ากัน เงาด้านล่างยาวแสดงว่ามีการขายอย่างรุนแรงในช่วงเวลาของแท่งเทียน แต่เนื่องจากราคาปิดใกล้กับราคาเปิด จึงแสดงว่าผู้ซื้อสามารถดูดซับการขายและดันราคากลับขึ้นไปได้
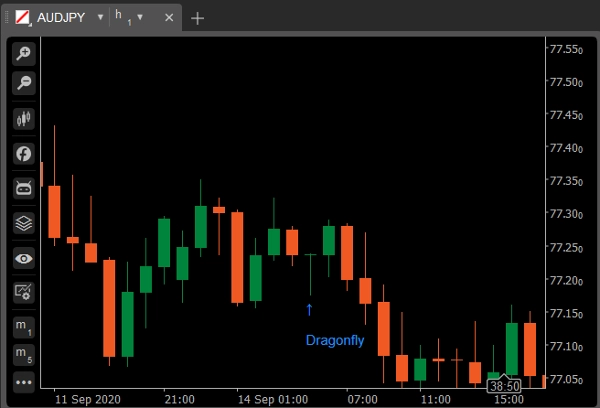
รูปแบบย่อย: Dragonfly Doji
โดจิแบบ gravestone เกิดขึ้นเมื่อราคาต่ำ ราคาเปิด และราคาปิด (เกือบ) เท่ากัน และแท่งเทียนมีเงาด้านบนยาว Gravestone ดูเหมือนตัว "T" คว่ำ ผลกระทบของ gravestone เหมือนกับ dragonfly ทั้งสองบ่งชี้ถึงความเป็นไปได้ของการกลับตัวของแนวโน้ม แต่ต้องได้รับการยืนยันโดยแท่งเทียนถัดไป
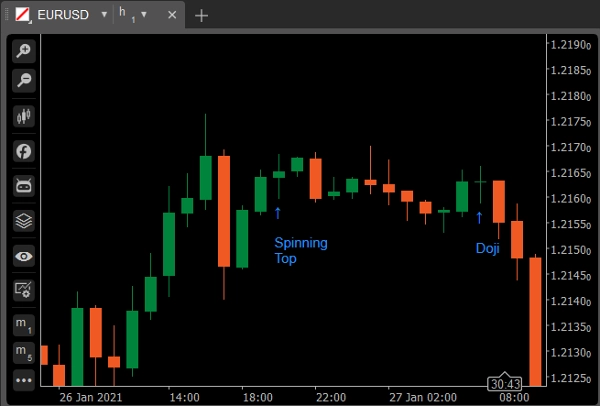
Spinning Top
Spinning Top เป็นรูปแบบแท่งเทียนที่มีตัวแท่งสั้นซึ่งอยู่กึ่งกลางในแนวตั้งระหว่างเงาด้านบนและด้านล่างที่ยาว รูปแบบแท่งเทียนนี้แสดงถึงความไม่แน่ใจเกี่ยวกับทิศทางในอนาคตของสินทรัพย์ ไม่มีทั้งผู้ซื้อหรือผู้ขายที่ได้เปรียบ ขนาดของตัวแท่งมีขีดจำกัดสูงสุดที่ 20% ของความยาวทั้งหมด
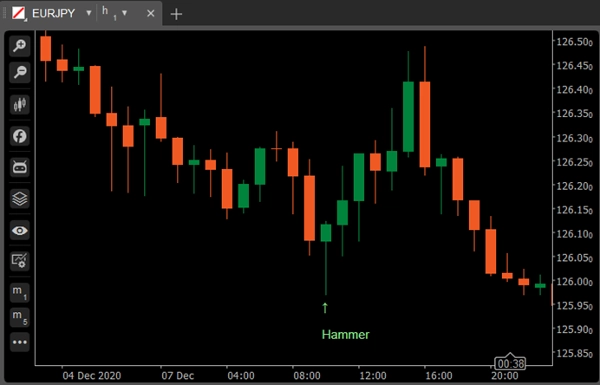
ค้อน
ค้อน คือแท่งเทียนสีเขียวหรือสีแดงที่มีตัวแท่งเล็กใกล้กับราคาสูงสุด โดยมีเงาด้านบนเล็กน้อยหรือไม่มีเลย และมีหางล่างยาว ถือเป็นรูปแบบขาขึ้นในช่วงแนวโน้มขาลง
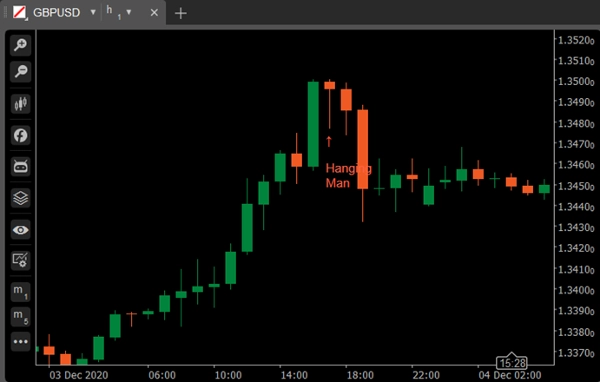
รูปแบบย่อย: Hanging Man
แท่งเทียนสีเขียวหรือสีแดงที่มีตัวแท่งเล็กใกล้กับราคาสูงสุด โดยมีเงาด้านบนเล็กน้อยหรือไม่มีเลย และมีหางล่างยาว ถือเป็นรูปแบบขาลงในช่วงแนวโน้มขาขึ้น
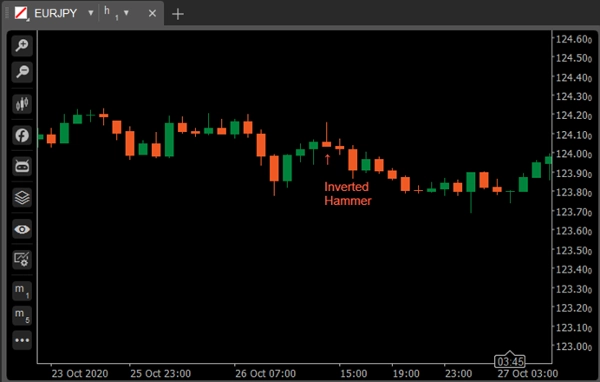
ค้อนกลับหัว
ค้อนกลับหัวเป็นรูปแบบแท่งเทียนชนิดหนึ่งที่พบหลังจากแนวโน้มขาลงและมักถูกตีความว่าเป็นสัญญาณกลับตัวของแนวโน้ม
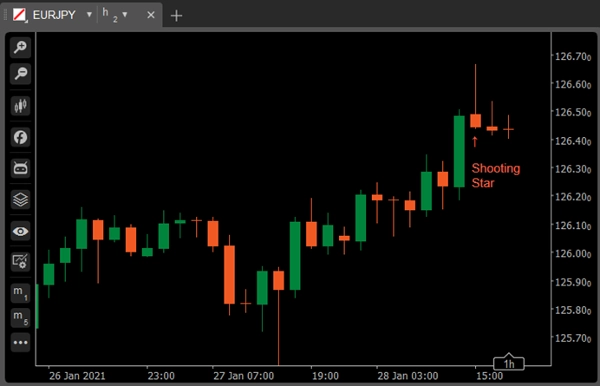
รูปแบบย่อย: Shooting Star
Shooting Star มีลักษณะเหมือนกับค้อนกลับหัว แต่แทนที่จะพบในแนวโน้มขาลง จะพบในแนวโน้มขาขึ้นและจึงมีความหมายที่แตกต่างกัน
มารูโบสุ
แท่งเทียนยาวหรือปกติ (สีแดงหรือสีเขียว) ที่ไม่มีเงาหรือหาง ราคาสูงสุดและต่ำสุดแทนราคาที่เปิดและปิด ถือเป็นรูปแบบต่อเนื่อง
รูปแบบย่อย: Marubozu Open
สำหรับ Marubozu Open ราคาที่เปิดควรเรียบ: กล่าวคือ การเคลื่อนไหวของราคาควรไปในทิศทางเดียวเท่านั้น แต่ต่างจากแท่งเทียน Marubozu เต็ม ราคาปิดด้านอื่นอาจแตกต่างเล็กน้อยจากราคาสูง/ต่ำ กล่าวอีกนัยหนึ่ง ราคาที่เปิดควรเรียบ ในขณะที่ยังมีพื้นที่สำหรับหางสั้นที่ด้านอื่น
รูปแบบย่อย: Marubozu Close
แท่งเทียน Marubozu Close ตรงกันข้ามกับ Marubozu Open: ราคาปิดควรเรียบ ในขณะที่การเคลื่อนไหวของราคาสามารถเคลื่อนไหวเล็กน้อยในทิศทางตรงกันข้ามก่อนที่จะเริ่มซื้อขายอย่างรุนแรงในทิศทางเดียว
Bullish Engulfing
ประกอบด้วยตัวแท่งสีแดงขนาดเล็กที่อยู่ภายในแท่งเทียนสีเขียวขนาดใหญ่ที่ตามมา เมื่อปรากฏที่ด้านล่างจะถูกตีความว่าเป็นสัญญาณกลับตัวหลัก
Bearish Engulfing
ประกอบด้วยตัวแท่งสีเขียวขนาดเล็กที่อยู่ภายในแท่งเทียนสีแดงขนาดใหญ่ที่ตามมา เมื่อปรากฏที่ด้านบนจะถือเป็นสัญญาณกลับตัวหลัก
Piercing Line
Piercing Line ประกอบด้วยแท่งเทียนสีแดงตามด้วยแท่งเทียนสีเขียวที่เปิดต่ำกว่าราคาต่ำสุดของแท่งก่อนหน้าแต่ปิดสูงกว่ากลางตัวแท่งสีแดง ถือเป็นสัญญาณกลับตัวเมื่อปรากฏที่ด้านล่าง
Dark Shadow Cover
ประกอบด้วยแท่งเทียนสีเขียวยาวตามด้วยแท่งเทียนสีแดงที่เปิดสูงกว่าราคาสูงสุดของแท่งสีเขียวและปิดลึกเข้าไปในตัวแท่งสีเขียว ถือเป็นสัญญาณกลับตัวขาลงในช่วงแนวโน้มขาขึ้น
Bullish Harami
ประกอบด้วยตัวแท่งสีแดงขนาดใหญ่ผิดปกติ ตามด้วยตัวแท่งสีเขียวขนาดเล็ก (อยู่ภายในตัวแท่งสีแดงขนาดใหญ่) ถือเป็นรูปแบบขาขึ้นเมื่อเกิดขึ้นหลังแนวโน้มขาลง
รูปแบบย่อย: Bullish Harami Cross
ตัวแท่งสีแดงขนาดใหญ่ตามด้วยโดจิ ถือเป็นสัญญาณกลับตัวเมื่อปรากฏที่ด้านล่าง
Bearish Harami
Bearish Harami ประกอบด้วยตัวแท่งสีเขียวขนาดใหญ่ผิดปกติ ตามด้วยตัวแท่งสีแดงขนาดเล็ก (อยู่ภายในตัวแท่งสีเขียวขนาดใหญ่) ถือเป็นรูปแบบขาลงเมื่อเกิดขึ้นหลังแนวโน้มขาขึ้น
รูปแบบย่อย: Bearish Harami Cross
ตัวแท่งสีเขียวขนาดใหญ่ตามด้วยโดจิ ถือเป็นสัญญาณกลับตัวเมื่อปรากฏที่ด้านบน
Bullish/Bearish Kicker
สัญญาณ Bullish Kicker มักเกิดขึ้นหลังจากข่าวใหญ่ที่ประกาศก่อนหรือหลังเวลาตลาด มีเหตุการณ์รุนแรงเกิดขึ้น ทำให้เกิดการเปลี่ยนแปลงอย่างมากในความรู้สึกของนักลงทุน และการกลับตัวจะเกิดขึ้นอย่างแน่นอน ยิ่งช่องว่างระหว่างแท่งเทียนสองแท่งใหญ่เท่าไร สัญญาณก็ยิ่งมีความสำคัญมากขึ้นเท่านั้น
ดาวรุ่ง/ดาวพลบค่ำ
ประกอบด้วยแท่งเทียนสีเขียวขนาดใหญ่ ตามด้วยแท่งเทียนขนาดเล็ก (สีแดงหรือสีเขียว) ที่มีช่องว่างเหนือแท่งก่อนหน้า แท่งที่สามเป็นแท่งเทียนสีแดงที่ปิดลึกเข้าไปในตัวแท่งสีเขียวขนาดใหญ่ ถือเป็นสัญญาณกลับตัวเมื่อปรากฏที่ระดับบนสุด
รูปแบบย่อย: Abandoned Baby
สามทหารเขียว/สามอีกาแดง
ประกอบด้วยแท่งเทียนสีเขียวยาวสามแท่งที่ปิดราคาสูงขึ้นอย่างต่อเนื่อง ราคาปิดอยู่ใกล้หรือที่ราคาสูงสุด เมื่อปรากฏที่ด้านล่างจะถูกตีความว่าเป็นสัญญาณกลับตัวที่ด้านล่าง
ประกอบด้วยแท่งเทียนสีแดงยาวสามแท่งที่ปิดราคาต่ำลงอย่างต่อเนื่อง ราคาปิดอยู่ใกล้หรือที่ราคาต่ำสุด เมื่อปรากฏที่ด้านบนถือเป็นสัญญาณกลับตัวที่ด้านบน
Three Line Strike
Three Line Strike คือกลุ่มแท่งเทียนต่อเนื่องที่มีสามแท่งในทิศทางของแนวโน้ม ตามด้วยแท่งสุดท้ายที่ดึงราคากลับไปยังจุดเริ่มต้น นักเทรดใช้ three line strike เป็นโอกาสในการซื้อที่จุดต่ำสุดของแนวโน้มล่าสุดหรือขายที่จุดสูงสุดล่าสุด
Two Red Gapping
รูปแบบต่อเนื่อง bearish two red gapping ปรากฏหลังจากจุดสูงสุดที่สำคัญในแนวโน้มขาขึ้น โดยมีช่องว่างลงที่ทำให้แท่งสีแดงสองแท่งมีราคาต่ำสุดลดลง รูปแบบนี้ทำนายว่าการลดลงจะดำเนินต่อไปถึงจุดต่ำสุดที่ต่ำลงอีก
สรุป
รีวิวจากลูกค้า
5 | 100 % | |
4 | 0 % | |
3 | 0 % | |
2 | 0 % | |
1 | 0 % |


