
Beschreibung
Pinescritlabs
Ctrader Store Indikatoren: 🤖Pinescritlabs Ctrader Store cBots:
Fair Value Gap Sessions Gold & BTC Breakout Session Pivots(neu)
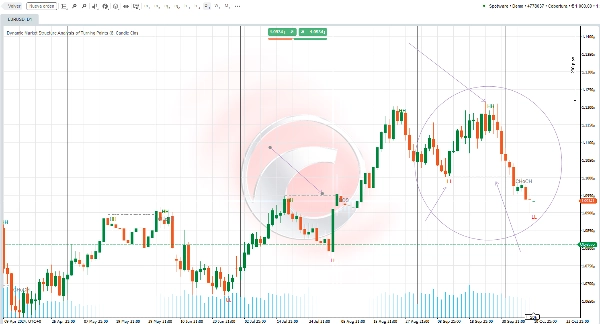
Dynamische Marktstruktur
Analyse von Wendepunkten
Fibonacci Linear
Regression Multi-Zeitrahmen
Multi-Level Kerzen-Bias
Tracker
Reaktive Gleitender Durchschnitt
Auto Unterstützung und
Widerstand Trendlinien
Alle Unterstützungs- und
Widerstandsniveaus
Übersicht der Indikatoreinstellungen 🌟
SCHWINGLÄNGE 📏
Dieser Parameter bestimmt, wie viele Balken links und rechts bei der Suche nach Schwingungspunkten berücksichtigt werden. Ein niedrigerer Wert zeigt mehr Punkte an, während ein höherer Wert deren Anzahl reduziert. Es wird empfohlen, diesen Parameter basierend auf Ihrem Handelsstil und beim Wechsel zwischen verschiedenen Zeitrahmen anzupassen.
CHOCH 🔄
Wenn diese Option aktiviert ist, wird der erste Gegen-Trend-Ausbruch als CHoCH (Change of Character) umbenannt, was auf eine mögliche Richtungsänderung des Marktes hinweist.
HH und LL 📈📉
Der Indikator zeichnet die Hochpunkte (HH) und Tiefpunkte (LL) der Schwingungen im Chart ein, sodass Sie die Marktstruktur effektiver visualisieren können.
BOS ⚡
Der Indikator zeigt auch die Break of Structure (BOS)-Niveaus an, wenn Ausbrüche an Schwingungspunkten erkannt werden, und bietet so zusätzliche Einblicke in die Marktdynamik.
Zusammenfassung
Kundenbewertungen
5 | 33 % | |
4 | 67 % | |
3 | 0 % | |
2 | 0 % | |
1 | 0 % |


