
คำอธิบาย
ตัวบ่งชี้ Pinescriptlabs Store: Pinescriptlabs Store cBots : (cBot) Gold & BTC BreakoutSession Pivots(ใหม่)
โครงสร้างตลาดขั้นสูง: Bos, Choch, SwinLevels, Order Blocks, Market Structure & Liquidity Finder (ใหม่)
การพยากรณ์สภาพคล่องราคา ZigZag
อัลกอริทึมสมาร์ทติดตาม (ใหม่)
แผนที่การชำระบัญชีด้วยเลเวอเรจ
SmartTrend สนับสนุน &
แนวต้าน
เส้น
ช่องว่างมูลค่ายุติธรรมตามช่วงเวลา
การวิเคราะห์
โครงสร้างตลาด
แบบไดนามิก
ของ
จุดกลับตัว
Points
ฟีโบนักชี
การถดถอยเชิงเส้น
หลายกรอบเวลา
Multi-timeframe
ช่องว่างมูลค่ายุติธรรมแบบโมเมนตัม
ตัวติดตาม
แนวโน้มแท่งเทียนหลายระดับ
Tracker
อัตโนมัติ
แนวรับและ
แนวต้าน
แนวโน้ม
เส้น
ทั้งหมด
แนวรับและ
แนวต้าน
ระดับ
โซนอุปทานและอุปสงค์
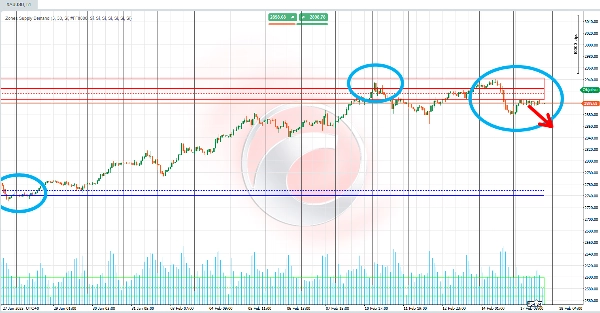
อัลกอริทึมวิเคราะห์การเคลื่อนไหวของราคาโดยใช้ การสะสมปริมาณ แบ่งช่วงราคาที่เห็นได้ (จากสูงไปต่ำ) ออกเป็นหลายช่วงหรือ "ช่วงเวลา" 📏 สำหรับแต่ละช่วง จะคำนวณปริมาณที่เกิดขึ้นและเปรียบเทียบกับ เปอร์เซ็นต์เกณฑ์ที่กำหนดไว้ล่วงหน้า เป้าหมาย? เพื่อระบุระดับที่มีความเข้มข้นของปริมาณสูงมากจนบ่งชี้ถึง โซนอุปทาน หรือ โซนอุปสงค์! 🎯
📉 สำหรับโซนอุปทาน:
- เริ่มจาก ราคาสูงสุด และเคลื่อนลงผ่านช่วงเวลา
- สะสมปริมาณในแต่ละช่วง
- เมื่อปริมาณสะสม เกินเกณฑ์ จะเป็นการกำหนด โซนอุปทาน 🚨.
- พื้นที่สี (สี่เหลี่ยมผืนผ้าพร้อมความทึบแสงเฉพาะ) จะถูกวาดจากระดับนี้ถึงสูงสุด พร้อมเส้นแนวนอนแสดง ค่าเฉลี่ยแบบง่ายและถ่วงน้ำหนัก ของราคาภายในโซนนี้ 🖍️
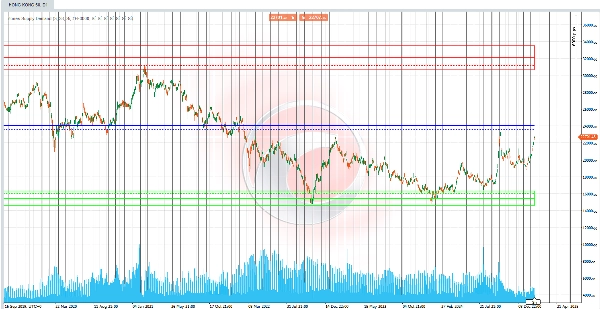
📈 สำหรับโซนอุปสงค์:
- เริ่มจาก ราคาต่ำสุด และเคลื่อนขึ้นผ่านช่วงเวลา
- สะสมปริมาณในแต่ละช่วง
- เมื่อปริมาณสะสม ข้ามเกณฑ์ จะเป็นการกำหนด โซนอุปสงค์ 🚨.
- พื้นที่ที่สอดคล้องกันจะถูกวาดขึ้น พร้อมเส้นค่าเฉลี่ยเพื่อเน้น ระดับความเข้มข้นเฉลี่ย 🖌️
⚖️ สมดุลตลาด:
เมื่อระบุทั้งโซนอุปทานและอุปสงค์แล้ว อัลกอริทึมจะคำนวณ จุดสมดุลตลาด! 🌟 สมดุลนี้ได้มาจากค่าเฉลี่ย (แบบง่ายหรือถ่วงน้ำหนักด้วยปริมาณ) ระหว่างสองโซน ผลลัพธ์? เส้นอ้างอิงที่ชัดเจนบนกราฟแสดงถึง สมดุลระหว่างแรงกดดันซื้อและขาย! ⚖️✨
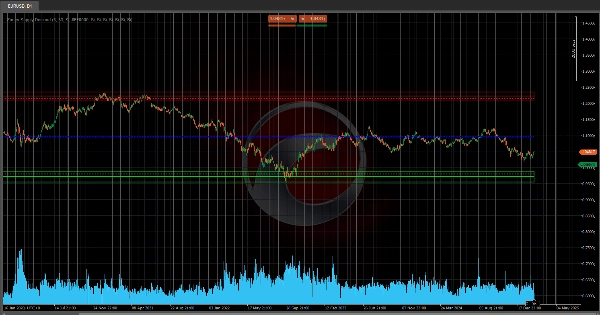
✅ สรุป:
ตัวบ่งชี้ "โซนอุปทานและอุปสงค์" ใช้ การแบ่งช่วงราคาตามปริมาณ เพื่อค้นหาพื้นที่สำคัญของการรวมคำสั่ง 🗝️ จากนั้นสร้างสัญญาณภาพ (โซนสี, เส้นค่าเฉลี่ย และจุดสมดุล) เพื่อเน้นระดับสำคัญบนกราฟ ช่วยให้เทรดเดอร์สามารถสังเกตเห็น ความไม่สมดุลของอุปทานและอุปสงค์ และจุดกลับตัวที่เป็นไปได้! 🚀💡
สรุป
รีวิวจากลูกค้า
5 | 0 % | |
4 | 50 % | |
3 | 50 % | |
2 | 0 % | |
1 | 0 % |


