
คำอธิบาย
ตัวบ่งชี้การเบรกเอาต์ความผันผวน - Hawkes Volatility Engine
ตัวบ่งชี้นี้มีไว้เพื่อให้บริบท ไม่ใช่การดำเนินการซื้อขายทันที ส่วนประกอบความผันผวนช่วยให้คุณทราบเมื่อสภาพตลาดเปลี่ยนแปลง - ช่วงเวลาความผันผวนต่ำมักเกิดขึ้นก่อนการเคลื่อนไหวครั้งใหญ่ และช่วงเวลาความผันผวนสูงในที่สุดก็จะหมดแรง ส่วนประกอบ EWMA ช่วยให้คุณทราบทิศทางแนวโน้มที่กำลังพัฒนาและเน้นเมื่อราคายืดออกจากแนวโน้มนั้น
รวมสองมุมมองนี้ - ระบอบความผันผวนและบริบทแนวโน้ม - กับวิธีการซื้อขายและการตัดสินใจของคุณ ตัวบ่งชี้จะแสดงสภาพแวดล้อมให้คุณ - คุณเป็นผู้ตัดสินใจว่าจะทำอะไรในนั้น
เวอร์ชัน 2.0
เปิดสำหรับการอัปเดตในอนาคต
-----------------------------------------------------------------------------------------------------------------------------------------------------------------------
ภาพรวม
-----------------------------------------------------------------------------------------------------------------------------------------------------------------------
ตัวบ่งชี้นี้รวมสองส่วนประกอบที่แตกต่างกันเพื่อช่วยผู้ซื้อขายระบุระบอบความผันผวนและสภาพแนวโน้มพร้อมกัน
ส่วนประกอบแรกใช้กระบวนการ Hawkes เพื่อจับการเปลี่ยนแปลงในความผันผวนของตลาด แตกต่างจากตัวบ่งชี้ความผันผวนแบบดั้งเดิม มันไม่ได้ทำนายทิศทาง—เพียงแค่ส่งสัญญาณเมื่อตลาดเปลี่ยนจากการบีบอัดเงียบไปสู่ความผันผวนที่ใช้งาน หรือในทางกลับกัน คิดว่ามันเป็นตัวตรวจจับสถานะความผันผวน: บอกคุณเมื่อสิ่งต่าง ๆ ร้อนขึ้นหรือลดลง แต่ไม่บอกว่าราคาจะเคลื่อนไปทางใด
ส่วนประกอบที่สองเพิ่มระบบ EWMA (ค่าเฉลี่ยเคลื่อนที่ถ่วงน้ำหนักแบบเลขชี้กำลัง) คู่ที่ซ้อนทับบนแผนภูมิราคาของคุณ ซึ่งให้บริบทแนวโน้มโดยใช้ค่าเฉลี่ยเคลื่อนที่เร็วและช้าแบบตัดกัน พร้อมชั้นสีเทียนเพิ่มเติมเพื่อแสดงเมื่อราคาห่างจากแนวโน้ม
-----------------------------------------------------------------------------------------------------------------------------------------------------------------------
วิธีการทำงาน
-----------------------------------------------------------------------------------------------------------------------------------------------------------------------
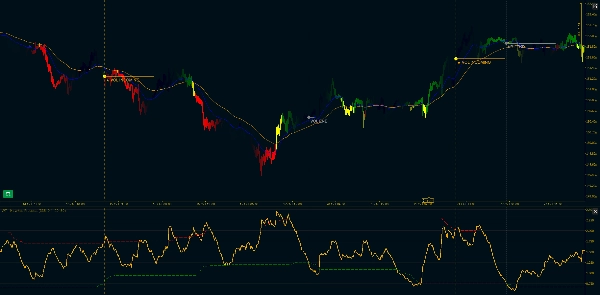
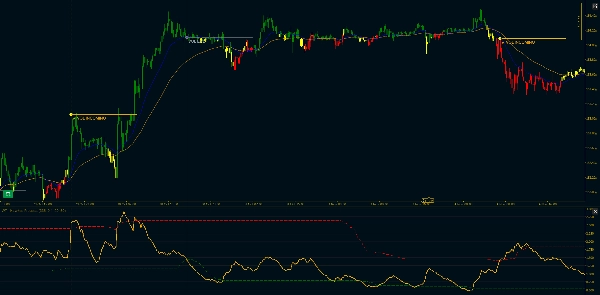
การตรวจจับความผันผวน: ตัวบ่งชี้ใช้ตัวประมาณความผันผวน Parkinson High-Low ซึ่งเป็นวิธีที่มีประสิทธิภาพมากกว่ามาตรฐาน ATR เพราะใช้ช่วงบาร์ทั้งหมด ความผันผวนที่ถูกทำให้เป็นมาตรฐานนี้จะถูกป้อนเข้าสู่การคำนวณกระบวนการ Hawkes ซึ่งจากนั้นจะถูกเปรียบเทียบกับเกณฑ์ที่อิงตามควอนไทล์แบบไดนามิก
เมื่อความผันผวนทะลุเกณฑ์บนหลังจากช่วงเวลาการบีบอัด คุณจะได้รับสัญญาณ "VOL INCOMING" เมื่อมันลดลงต่ำกว่าเกณฑ์ล่าง คุณจะเห็น "VOL END" สัญญาณเหล่านี้ไม่ใช่สัญญาณเข้าเทรด—แต่เป็นการเปลี่ยนแปลงระบอบความผันผวน ตลาดกำลังตื่นตัวหรือกำลังหลับ
บริบทแนวโน้ม: มีค่าเฉลี่ยเคลื่อนที่ถ่วงน้ำหนักแบบเลขชี้กำลังสองเส้น (เร็วและช้า) ปรากฏบนแผนภูมิหลักของคุณ ค่าเฉลี่ยเคลื่อนที่เร็วเป็นสีน้ำเงิน ค่าเฉลี่ยเคลื่อนที่ช้าเป็นสีส้ม เมื่อค่าเฉลี่ยเคลื่อนที่เร็วอยู่เหนือค่าเฉลี่ยเคลื่อนที่ช้า แนวโน้มจะเป็นขาขึ้น เมื่อค่าเฉลี่ยเคลื่อนที่เร็วอยู่ต่ำกว่าค่าเฉลี่ยเคลื่อนที่ช้า แนวโน้มจะเป็นขาลง
ตัวกรองความแตกต่าง: นี่คือส่วนที่น่าสนใจ บางครั้งราคาจะดึงตัวออกจากแนวโน้มอย่างมีนัยสำคัญ เมื่อเทียนทั้งหมด (เปิด สูง ต่ำ ปิด) อยู่ต่ำกว่าค่าเฉลี่ยเคลื่อนที่เร็วในช่วงแนวโน้มขาขึ้น หรือสูงกว่าค่าเฉลี่ยเคลื่อนที่เร็วในช่วงแนวโน้มขาลง แท่งเทียนจะเปลี่ยนเป็นสีเหลือง นี่คือตัวกรองที่เข้มงวด—ถ้าปลายเทียนแตะค่าเฉลี่ยเคลื่อนที่เร็ว มันจะยังคงเป็นสีของแนวโน้มปกติ
แท่งเทียนสีเหลืองมักปรากฏในช่วงการย้อนกลับหรือจุดหมดแรง แต่จำไว้ว่า: มันไม่ได้บอกว่าต่อไปจะเกิดอะไรขึ้น เพียงแค่ราคาชั่วคราวแยกออกจากเส้นแนวโน้ม
-----------------------------------------------------------------------------------------------------------------------------------------------------------------------
คุณสมบัติหลัก
-----------------------------------------------------------------------------------------------------------------------------------------------------------------------
ส่วนประกอบความผันผวน:
- การทำให้เป็นมาตรฐานความผันผวน Parkinson High-Low (มีประสิทธิภาพมากกว่าวิธี ATR มาตรฐาน)
- การคำนวณกระบวนการ Hawkes พร้อมการปรับค่าการลดทอน (พารามิเตอร์ Kappa)
- เกณฑ์ที่อิงตามควอนไทล์แบบไดนามิก (เปอร์เซ็นไทล์ที่ปรับแต่งได้)
- เครื่องหมายแสดงผล: "VOL INCOMING" เมื่อเกิดการเบรกเอาต์ความผันผวน, "VOL END" เมื่อเกิดการบีบอัด
- การกรองการต่อเนื่อง: มีการทำเครื่องหมายเฉพาะเบรกเอาต์แรกเท่านั้น ไม่ใช่ทุกการพุ่งขึ้น
- เส้นแนวโน้มแนวนอนและเครื่องหมายแนวตั้งเป็นตัวเลือกเสริม
ส่วนประกอบแนวโน้ม EWMA:
- การคำนวณ EWMA ที่เข้ากันได้กับ Pandas (สูตร adjust=True)
- เส้น MA เร็วและช้าแสดงบนแผนภูมิราคาหลัก
- ความยาวช่วงที่ปรับแต่งได้ (ค่าเริ่มต้น: 20/50)
- รองรับช่วงเวลาขั้นต่ำ (ปิดการแสดงผลจนกว่าจะมีข้อมูลเพียงพอ)
- ตัวเลือกละเว้นค่า NA สำหรับจัดการช่องว่าง
- ระบบเทียนสามสี: เขียว (แนวโน้มขาขึ้น), แดง (แนวโน้มขาลง), เหลือง (ความแตกต่าง)
ตัวเลือกการปรับแต่ง:
- ช่วงเวลาของ Parkinson (ระยะเวลาย้อนหลังสำหรับการคำนวณความผันผวน)
- Kappa ของ Hawkes (อัตราการลดทอน มีผลต่อความไว)
- ช่วงเวลาย้อนหลังของควอนไทล์
- เกณฑ์ความผันผวนต่ำและสูง (เปอร์เซ็นไทล์)
- สวิตช์การแปลงเป็นรายปีและความยาวส่วน
- ช่วงเร็วและช้าสำหรับค่าเฉลี่ยเคลื่อนที่
- สีสำหรับขาขึ้น ขาลง และความแตกต่าง
- ความยาวการขยายเส้นแนวโน้ม
- แสดง/ซ่อนเครื่องหมายแนวตั้ง
----------------------------------------------------------------------------------------------------------------------------------------------------------------------------
บันทึกทางเทคนิค: ส่วนประกอบกระบวนการ Hawkes ใช้การคำนวณเลขชี้กำลังแบบวนซ้ำที่ปรับแต่งสำหรับการใช้งานแบบเรียลไทม์ การใช้งาน EWMA สอดคล้องกับพฤติกรรมของ Pandas เพื่อความสม่ำเสมอกับการทดสอบย้อนหลังที่ใช้ Python ทั้งสองส่วนประกอบคำนวณเฉพาะบนแท่งที่ปิดแล้วเพื่อหลีกเลี่ยงการวาดซ้ำ
สรุป
รีวิวจากลูกค้า
5 | 100 % | |
4 | 0 % | |
3 | 0 % | |
2 | 0 % | |
1 | 0 % |


