
คำอธิบาย
⚠️ เราย้ายไปที่ 👉 PrimeQuant
🚫🚫🚫 อย่าซื้ออินดิเคเตอร์นี้!
⚡ เวอร์ชันรุ่นถัดไปพร้อมใช้งาน: เครื่องมือ LudwigICT คลาสสิกนี้ได้รับการออกแบบใหม่ โครงสร้างใหม่ และปล่อยใหม่ภายใต้แบรนด์นักพัฒนาของเราใหม่, PrimeQuant. เวอร์ชันใหม่มีอินเทอร์เฟซที่เรียบง่ายและคุณสมบัติที่อัปเดตสำหรับสภาพตลาดปัจจุบัน รับเวอร์ชันอัปเกรดในราคาลดพิเศษที่นี่:
👉 ALMA-Gaussian Trend Filter
👉 ALMA-Gaussian Trend Filter
👉 ALMA-Gaussian Trend Filter
(โปรดทราบ: รายการ LudwigICT ยังคงใช้งานได้สำหรับผู้ใช้รุ่นเก่า แต่จะไม่ได้รับการอัปเดตหรือส่วนลดราคาอย่างต่อเนื่องอีกต่อไป)
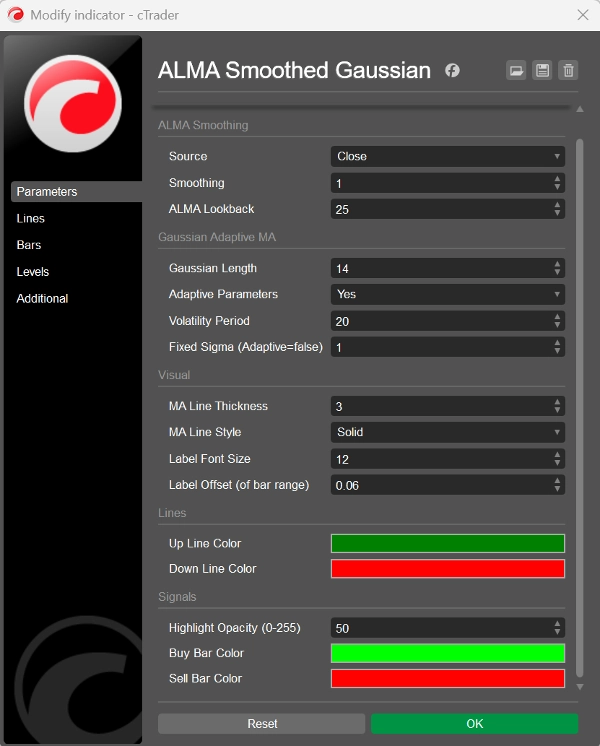
ALMA Smoothed Gaussian Moving Average (ASGMA) – โดย LudwigICT
เป็น อินดิเคเตอร์ติดตามแนวโน้มที่แม่นยำ ที่ผสาน การทำให้เรียบแบบ ALMA กับ ค่าเฉลี่ยเคลื่อนที่แบบ Gaussian ที่ปรับตัวได้ เพื่อตัดเสียงรบกวนและเผยให้เห็น ความลำเอียง ที่แท้จริงของตลาด
🔹 วิธีการทำงาน:
- ใช้แหล่งราคาที่คุณเลือก (ปิด, เปิด, สูง, ต่ำ, HL2, HLC3, OHLC4)
- วัดการเปลี่ยนแปลงเป็นเปอร์เซ็นต์และทำให้เรียบด้วย ALMA (Arnaud Legoux MA)
- ใช้ ฟิลเตอร์ Gaussian (ปรับตัวตามความผันผวน หรือคงที่) เพื่อเส้นแนวโน้มที่ละเอียดขึ้น
- ยืนยันทิศทางด้วย EMA ของราคาปิด (7) เพื่อการจัดตำแหน่งที่ตอบสนอง
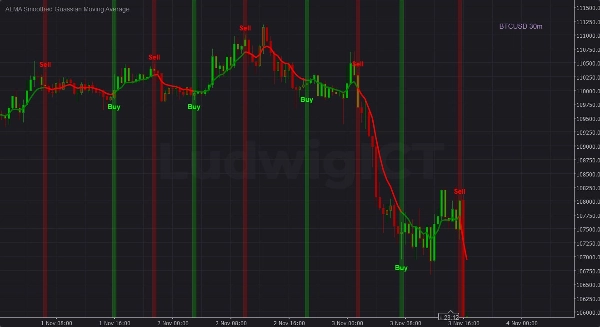
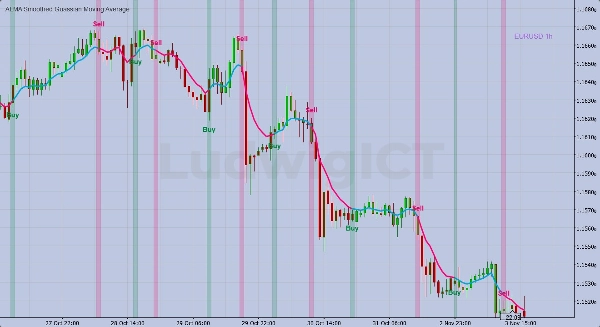
🔹 สิ่งที่คุณเห็นบนกราฟ:
- เส้นแนวโน้ม: สีเขียว = แนวโน้มขาขึ้น, สีแดง = แนวโน้มขาลง
- แท่งเทียนเปลี่ยนสี: สีของตัวแท่งและไส้เทียนที่สอดคล้องกับแนวโน้มเพื่อการรับรู้ความลำเอียงทันที
- สัญญาณซื้อ/ขาย: แถบที่เน้นและป้ายตัวหนาเมื่อ ALMA ตัดผ่านเหนือ/ใต้ Gaussian MA
- ไฮไลท์เต็มความสูง: มองเห็นได้ชัดเจนเมื่อเลื่อนหรือซูม (ไม่มีสัญญาณที่พลาด)
🔹 สิ่งที่มอบให้กับเทรดเดอร์:
✅ แผนที่แนวโน้มที่ สะอาดและไม่มีดีเลย์
✅ สัญญาณซื้อ/ขายที่รวดเร็วเมื่อแรงโมเมนตัมเปลี่ยน
✅ กราฟที่ไม่รก เพิ่มความมั่นใจในการดำเนินการ
👉 สรุป: นี่คืออินดิเคเตอร์แนวโน้มที่แม่นยำซึ่งกรองเสียงรบกวน ปรับตัวตามความผันผวน และให้สัญญาณซื้อ/ขายที่ชัดเจนด้วยภาพ
หากคุณมีคำถามหรือพบปัญหาใด ๆ โปรดติดต่อฉัน ยินดีช่วยเหลือคุณ!
ข้อจำกัดความรับผิดชอบ:
โดยการใช้สูตรของฉัน คุณรับทราบว่าการเทรดมีความเสี่ยงโดยธรรมชาติและผลการดำเนินงานในอดีตไม่ได้รับประกันผลลัพธ์ในอนาคต สิ่งสำคัญคือคุณต้องมีแผนการจัดการความเสี่ยงที่มั่นคง และเหนือสิ่งอื่นใด คุณต้องมีวินัยในการปฏิบัติตามระดับหยุดขาดทุนอย่างเคร่งครัด การไม่จัดการความเสี่ยงอย่างเหมาะสมอาจนำไปสู่การขาดทุนอย่างมาก ฉันไม่รับผิดชอบต่อผลลัพธ์ทางการเงินใด ๆ ที่เกิดจากการใช้สูตรเหล่านี้ เทรดอย่างมีความรับผิดชอบและปฏิบัติตามแนวทางการจัดการความเสี่ยงอย่างถูกต้องเสมอ
ขอให้โชคดี! 🙌
สรุป
รีวิวจากลูกค้า
5 | 33 % | |
4 | 67 % | |
3 | 0 % | |
2 | 0 % | |
1 | 0 % |


