
คำอธิบาย
⚠️ เราย้ายไปที่ 👉 PrimeQuant
🚫🚫🚫 อย่าซื้ออินดิเคเตอร์นี้!
ICT CONCEPTS โดย LudwigICT (เทียบเท่าของ cTrader สำหรับ ICT Concepts ยอดนิยมใน TradingView)
สัมผัสความแม่นยำระดับสถาบันด้วย ICT Concepts — ชุดเครื่องมือ Smart Money ครบวงจรที่สร้างขึ้นเพื่อแสดงภาพตลาดในแบบที่มืออาชีพเห็น
🔹 คุณสมบัติ
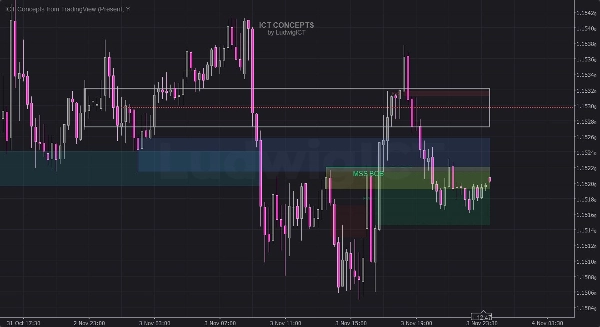
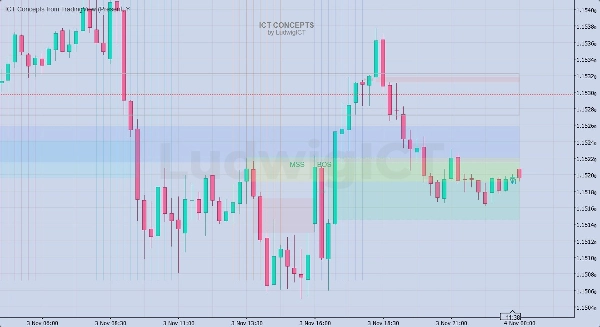
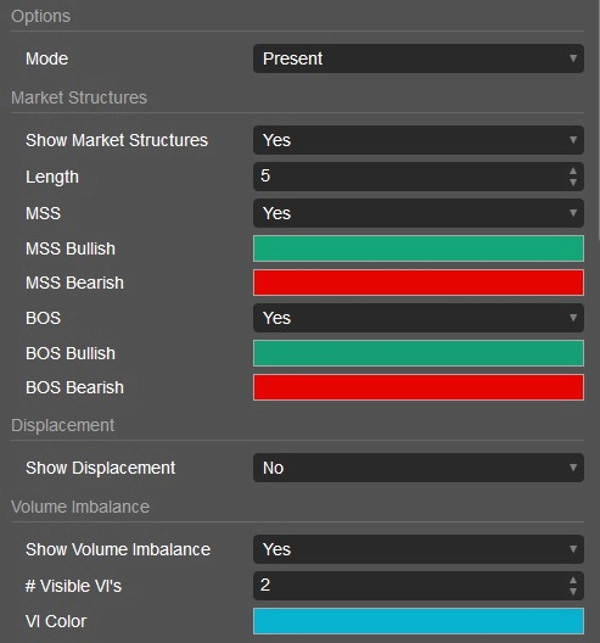
- 📈 การตรวจจับโครงสร้างตลาด — ไฮไลต์ BOS (Break of Structure) และ MSS (Market Structure Shift) อัตโนมัติที่ปรับตามการเคลื่อนไหวของราคาแบบเรียลไทม์
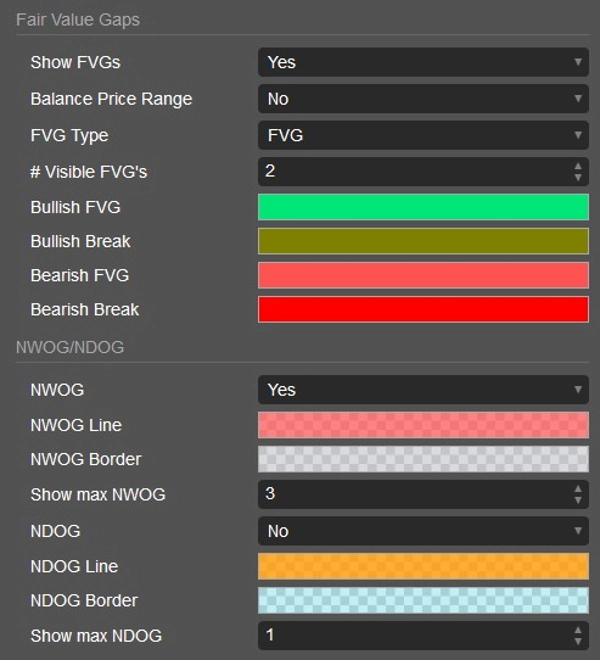
- 🟩 ช่องว่างมูลค่ายุติธรรม (FVG) และช่วงราคาสมดุล (BPR) — ระบุโซนพรีเมียมและส่วนลดทันที เหมือนในโมเดล ICT มืออาชีพ
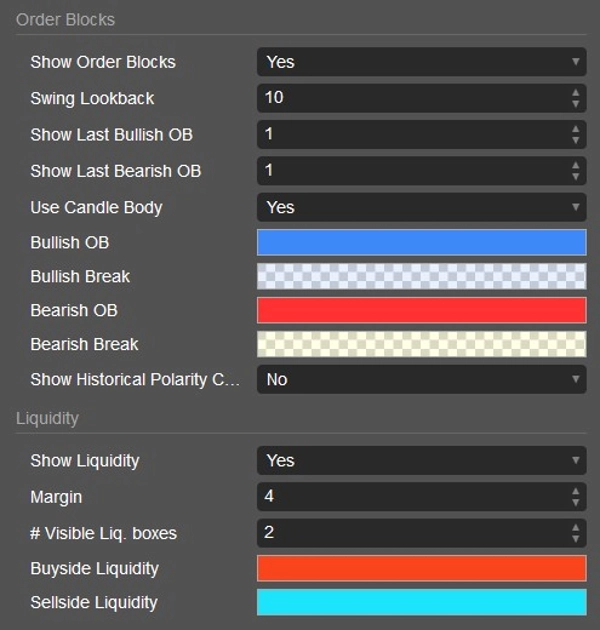
- 💧 โซนสภาพคล่อง — ทำเครื่องหมายพูลสภาพคล่องฝั่งซื้อและฝั่งขายโดยอัตโนมัติซึ่งราคามีแนวโน้มจะค้นหาหรือมีปฏิกิริยา
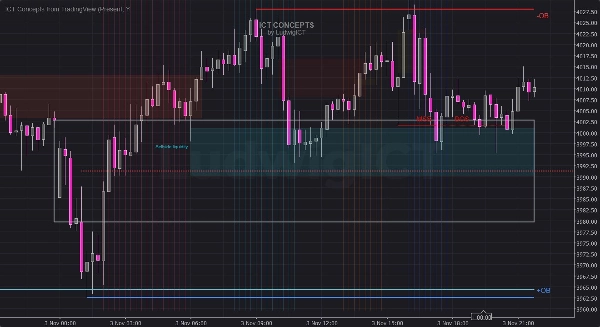
- 🧱 บล็อกคำสั่ง (OB) — ระบุบล็อกคำสั่งขาขึ้นและขาลงและติดตามว่าบล็อกเหล่านั้นยังคงอยู่หรือถูกทำลาย
- ⚡ ความไม่สมดุลของปริมาณและแท่งเทียนเลื่อนตำแหน่ง — แสดงความแข็งแกร่งและความไม่มีประสิทธิภาพของสถาบันระหว่างผู้ซื้อและผู้ขาย
- 🌅 ช่องว่าง NWOG / NDOG — แสดงช่องว่างเปิดรายสัปดาห์และรายวันเพื่อเน้นพื้นที่ราคาที่ขาดหายไป
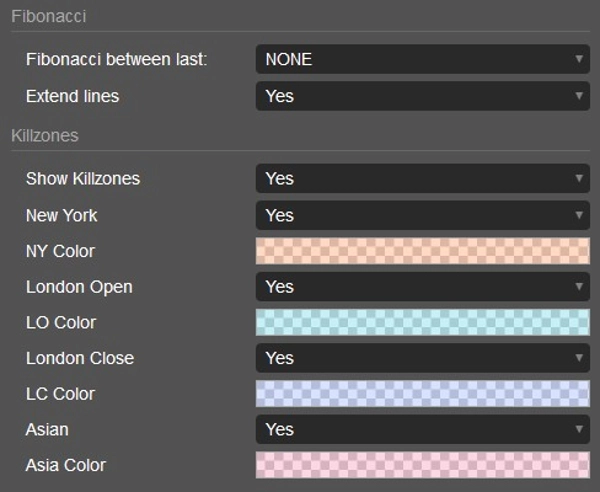
- 🕓 การซ้อนทับ Killzones — แสดงเซสชันลอนดอน นิวยอร์ก และเอเชียสำหรับการรวมเวลาที่สอดคล้องกัน
- 🔢 เป้าหมายฟีโบนักชีแบบบูรณาการ — วาดเส้นถอยหลังและการฉายภาพโดยอัตโนมัติที่สอดคล้องกับโครงสร้างที่คุณเลือก
🧭 วิธีใช้
- แนบอินดิเคเตอร์กับชาร์ตใดก็ได้และเก็บ การตั้งค่าเริ่มต้น เพื่อเริ่มต้น — มันจะปรับตัวโดยอัตโนมัติตามสัญลักษณ์และกรอบเวลา
- รวมหลายแนวคิด: ตัวอย่างเช่น มองหาการจัดเรียง BOS + FVG + OB เพื่อการตั้งค่าความน่าจะเป็นสูง
- ใช้เพื่อ ศึกษาพฤติกรรมราคา รอบพูลสภาพคล่อง แท่งเทียนเลื่อนตำแหน่ง และช่องว่างรายสัปดาห์
- สำหรับเทรดเดอร์รายวัน เปิดใช้งาน Killzones เพื่อเน้นเซสชันที่มีความเคลื่อนไหวมากที่สุด
- ปรับขีดจำกัดการมองเห็น (เช่น “Visible FVGs” หรือ “Max NWOG”) ให้ตรงกับความชัดเจนของชาร์ตที่คุณต้องการ
เครื่องมือนี้ทำงานได้อย่างราบรื่นใน Forex, ดัชนี, สินค้าโภคภัณฑ์, สกุลเงินดิจิทัล และหุ้น — เหมาะสำหรับทั้งการวิเคราะห์และการดำเนินการ
⚙️ ทำไมผลลัพธ์อาจแตกต่างเล็กน้อยระหว่างโบรกเกอร์หรือ TradingView
cTrader ใช้ เวลาของเซิร์ฟเวอร์ โฟดสัญลักษณ์ และการรวบรวมข้อมูล ของโบรกเกอร์ของคุณ ในขณะที่ TradingView มักใช้ ฟีดแบบผสมหรือสังเคราะห์.
ความแตกต่างเล็กน้อยในการปิดแท่งเทียน การจัดการข้อมูลวันหยุดสุดสัปดาห์ หรือการตั้งราคาทศนิยม อาจทำให้ตำแหน่งของโครงสร้าง (เช่น BOS หรือ OB) เปลี่ยนแปลงเล็กน้อย
สิ่งเหล่านี้เป็นเรื่องปกติในแพลตฟอร์มการเทรดและ ไม่มีผลต่อหลักการหรือความน่าเชื่อถือ ของแนวคิดเหล่านี้
⚠️ ข้อจำกัดความรับผิดชอบ
อินดิเคเตอร์นี้เป็นเครื่องมือวิเคราะห์ระดับมืออาชีพ — ไม่ใช่คำแนะนำทางการเงิน.
โปรดทำการวิเคราะห์ด้วยตนเองและบริหารความเสี่ยงอย่างรับผิดชอบก่อนทำการเทรดใดๆ
สรุป
รีวิวจากลูกค้า
5 | 50 % | |
4 | 50 % | |
3 | 0 % | |
2 | 0 % | |
1 | 0 % |


