
คำอธิบาย
เราได้ย้ายไปที่ 👉 PrimeQuant
🚫🚫🚫 อย่าซื้ออินดิเคเตอร์นี้!
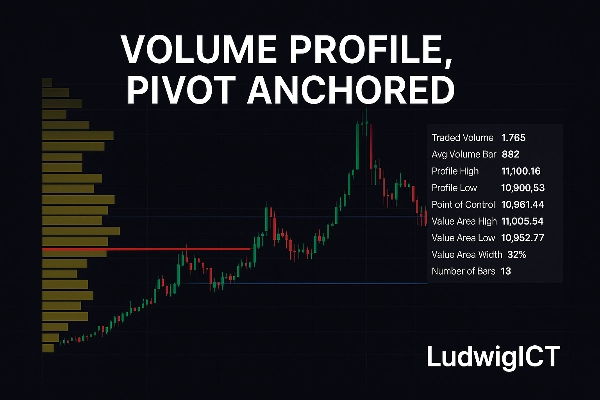
Volume Profile, Pivot Anchored indicator นำเสนอวิธีการวิเคราะห์โครงสร้างตลาดและปริมาณในระดับมืออาชีพโดยตรงใน cTrader ออกแบบมาสำหรับเทรดเดอร์ที่ให้ความสำคัญกับความชัดเจน ความแม่นยำ และข้อมูลเชิงลึกที่นำไปใช้ได้จริง ซึ่งแสดงให้เห็นว่ากิจกรรมการซื้อขายกระจายตัวอย่างไรในราคาภายในช่วงสวิงที่มีความหมาย
⚡ข้อเสนอพิเศษ – จำกัดเฉพาะผู้ซื้อ 10 คนแรกเท่านั้น!⚡
ปลดล็อกศักยภาพเต็มที่ของกลยุทธ์การเทรดของคุณด้วย อินดิเคเตอร์กำหนดเอง ที่ทรงพลังนี้ ออกแบบมาเพื่อให้คุณได้เปรียบที่แม่นยำในตลาด เครื่องมือนี้ถูกสร้างขึ้นสำหรับเทรดเดอร์ที่จริงจังที่ต้องการ สัญญาณที่ชัดเจนและนำไปใช้ได้จริง และการตัดสินใจที่ดีขึ้นเมื่อเทรด XAU/USD และคู่ Forex อื่นๆ.
🚀 ทำไมต้องซื้อเดี๋ยวนี้:
มีจำหน่ายใน ราคาพิเศษช่วงเปิดตัว – สำหรับเทรดเดอร์ 10 คนแรกเท่านั้น
เข้าถึง ข้อมูลเชิงลึกของการเคลื่อนไหวราคาขั้นสูง
สร้างขึ้นเพื่อ ความแม่นยำและความน่าเชื่อถือสูง
เหมาะสำหรับทั้ง การเทรดสั้นและสวิงเทรด
เมื่อขายครบ 10 ชุด ข้อเสนอนี้จะ ไม่สามารถใช้ได้ในราคานี้อีกต่อไป รีบจองสำเนาของคุณวันนี้และยกระดับการเทรดของคุณ!
มันทำอะไรได้บ้าง?
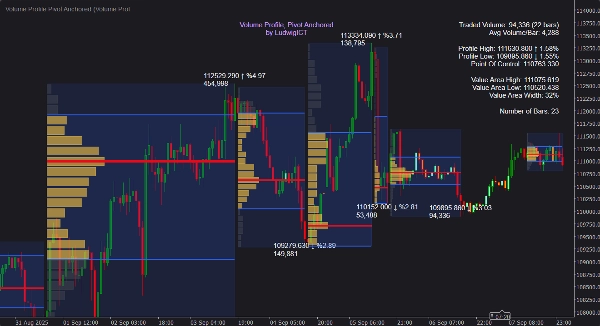
แตกต่างจากโปรไฟล์ที่กำหนดตายตัวหรือขึ้นอยู่กับช่วงเวลา เครื่องมือนี้จะยึดโปรไฟล์ปริมาณกับจุด Pivot สูงและต่ำที่สำคัญโดยอัตโนมัติ ทำแผนที่กระบวนการประมูลของแต่ละสวิงอย่างไดนามิก ทำให้เห็นได้ว่าผู้เข้าร่วมตลาดจริงๆ ลงทุนเงินทุนที่ไหน — ไม่ใช่แค่ที่ราคาขยับไปเท่านั้น
✨ องค์ประกอบสำคัญ ได้แก่:
📍 การตรวจจับ Pivot อัตโนมัติ – โปรไฟล์ถูกสร้างขึ้นระหว่างจุดสวิงสูงและต่ำ โดยอัปเดตเมื่อมี Pivot ใหม่เกิดขึ้น
📊 การแจกแจงปริมาณอย่างละเอียด – ฮิสโตแกรมแสดงการจัดสรรปริมาณตามราคา โดยมีความละเอียดและความกว้างที่ผู้ใช้กำหนดได้
🎯 ระดับ Value Area & POC – การคำนวณและแสดงผลทันทีของจุดควบคุม (POC), ค่าสูงสุดของ Value Area (VAH) และค่าต่ำสุดของ Value Area (VAL)
📈 โปรไฟล์ที่กำลังพัฒนา – โปรไฟล์ที่อัปเดตสดบนขาเทรดปัจจุบันให้บริบทล่วงหน้า
➡️ การขยายโซน POC – ฉายภาพ POC ไปข้างหน้าจนกว่าราคาจะสัมผัสหรือข้ามผ่าน เน้นโซนปฏิกิริยาในอนาคต
📝 ป้ายและคำแนะนำที่ให้ข้อมูล – ป้ายราคา, เปอร์เซ็นต์การเปลี่ยนแปลง, ปริมาณสะสม และแผงสถิติที่สะอาดเมื่อวางเมาส์
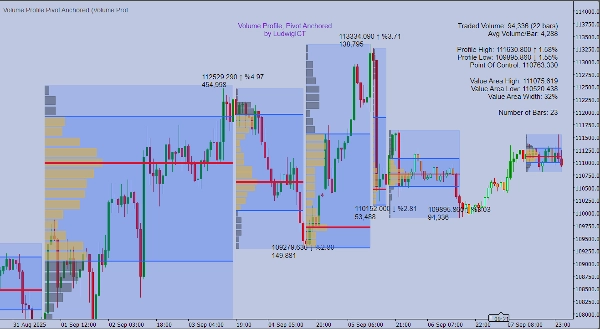
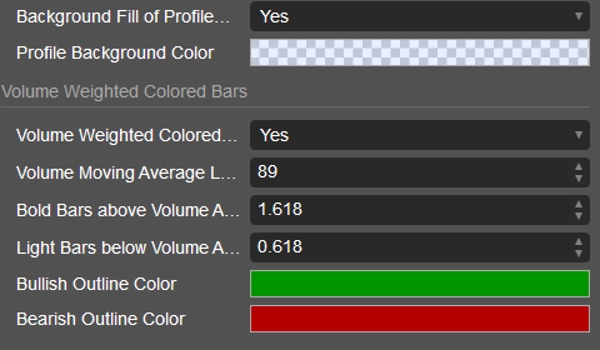
🎨 การลงสีแท่งเทียนตามน้ำหนักปริมาณ – แท่งเทียนที่ลงสีตามความเข้มของปริมาณเพื่อการจดจำรูปแบบอย่างรวดเร็ว
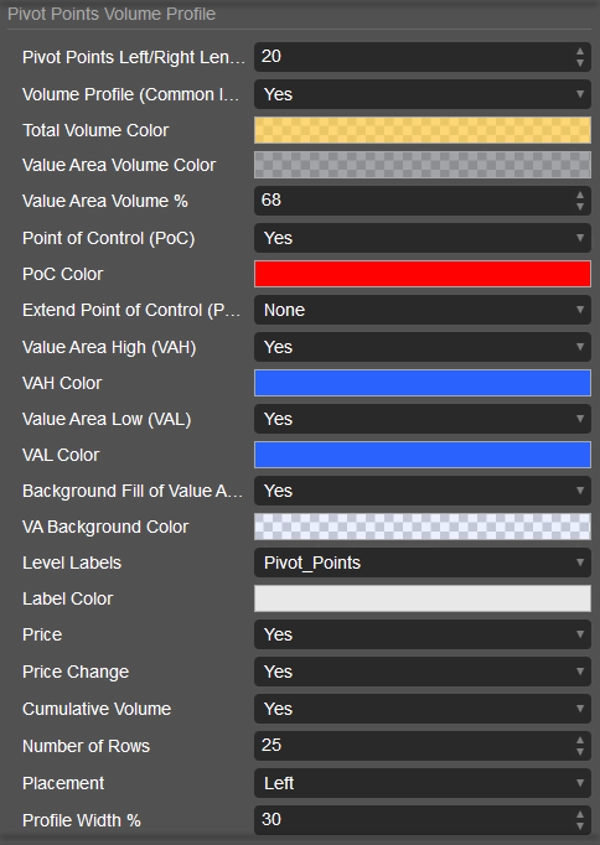
⚙️ การปรับแต่งเต็มรูปแบบ – ปรับสี ตำแหน่ง และการแสดงผลให้เข้ากับสไตล์แผนภูมิของคุณอย่างลงตัว
วิธีใช้
1️⃣ แนบกับแผนภูมิใดก็ได้ – ใช้งานได้กับทุกกรอบเวลาและเครื่องมือ
2️⃣ ปรับความยาว Pivot – ควบคุมความไวต่อจุดสวิงสูง/ต่ำ (สั้น = โปรไฟล์มากขึ้น, ยาว = โครงสร้างหลักเท่านั้น)
3️⃣ แปลความโปรไฟล์ในบริบท:
• 🎯 POC – ระดับราคาที่มีปริมาณการซื้อขายมากที่สุด มักเป็นแม่เหล็กดึงดูด
• 📏 VAH / VAL – ขอบเขตของ Value Area สนับสนุน/ต้านทานที่แข็งแกร่ง
• 🌀 รูปร่างฮิสโตแกรม – ระบุพื้นที่สมดุล โซนปฏิเสธ และการเปลี่ยนแปลงการแจกแจง
4️⃣ ติดตามโปรไฟล์ที่กำลังพัฒนา – ดูโครงสร้างการประมูลที่สร้างขึ้นแบบเรียลไทม์
5️⃣ ใช้การแจ้งเตือน – รับการแจ้งเตือนเมื่อราคามีปฏิสัมพันธ์กับ POC, VAH, VAL หรือเมื่อมีแท่งเทียนที่มีปริมาณสูงปรากฏ
6️⃣ ใช้เป็นกรอบการทำงาน – ปรับปรุงจุดเข้าเทรดที่ระดับตามปริมาณ คาดการณ์การกลับตัว และยืนยันแนวโน้มผ่านโครงสร้างปริมาณ
ทำไมเทรดเดอร์ถึงใช้มัน
อินดิเคเตอร์นี้แปลงปริมาณดิบให้เป็นโครงสร้างที่มีความหมาย โดยการยึดโปรไฟล์กับ Pivot มันปรับตัวเข้ากับพลวัตตลาดสดแทนที่จะพึ่งพาการแบ่งช่วงเวลาที่สุ่มสี่สุ่มห้า ไม่ว่าจะเป็นการเทรดระหว่างวัน สวิง หรือแบบตำแหน่ง การแจกแจงปริมาณที่ยึดกับ Pivot ให้ความชัดเจนลึกซึ้งยิ่งขึ้นสำหรับการตัดสินใจ
พารามิเตอร์สำคัญในภาพรวม
⚙️ ความไวของ Pivot – กำหนดความเข้มข้นในการตรวจจับจุดสวิง
📊 ระดับและความกว้างของโปรไฟล์ – ควบคุมความละเอียดและการมองเห็นของโปรไฟล์
🎯 โหมดขยาย POC – ไม่มี, จนถึงแท่งสุดท้าย, จนกว่าจะสัมผัส, หรือจนกว่าจะข้าม
📏 เปอร์เซ็นต์ Value Area – ปรับได้เต็มที่ (ค่าเริ่มต้น 68%)
🎨 การลงสีปริมาณ – เกณฑ์สำหรับเน้นการมีส่วนร่วมที่แข็งแกร่ง/อ่อนแอ
Volume Profile, Pivot Anchored โดย LudwigICT ไม่ใช่แค่การแสดงผลภาพทั่วไป — มันคือเลนส์โครงสร้างที่แสดงให้เห็นว่าตลาดประมูลอย่างไรจริงๆ สำหรับเทรดเดอร์ที่ต้องการเครื่องมือระดับมืออาชีพ มันให้ข้อได้เปรียบที่ชัดเจนในการอ่านปฏิสัมพันธ์ระหว่างราคาและปริมาณ
หากคุณมีคำถามหรือติดปัญหาใดๆ โปรดติดต่อฉันได้เลย ฉันยินดีช่วยเหลือคุณ!
ข้อจำกัดความรับผิดชอบ:
โดยการใช้สูตรของฉัน คุณรับทราบว่าการเทรดมีความเสี่ยงโดยธรรมชาติและผลการดำเนินงานในอดีตไม่ได้รับประกันผลลัพธ์ในอนาคต สิ่งสำคัญคือคุณต้องมีแผนการจัดการความเสี่ยงที่มั่นคง และเหนือสิ่งอื่นใด คุณต้องมีวินัยในการปฏิบัติตามระดับหยุดขาดทุนอย่างเคร่งครัด การไม่จัดการความเสี่ยงอย่างถูกต้องอาจนำไปสู่การขาดทุนอย่างมาก ฉันไม่รับผิดชอบต่อผลลัพธ์ทางการเงินใดๆ ที่เกิดจากการใช้สูตรเหล่านี้ โปรดเทรดอย่างรับผิดชอบและปฏิบัติตามแนวทางการจัดการความเสี่ยงอย่างถูกต้องเสมอ
ขอให้โชคดี! 🙌
สรุป
รีวิวจากลูกค้า
5 | 67 % | |
4 | 33 % | |
3 | 0 % | |
2 | 0 % | |
1 | 0 % |


