
คำอธิบาย
⚡ รุ่นถัดไปพร้อมใช้งาน: 🚫🚫🚫 อย่าซื้ออินดิเคเตอร์นี้ที่นี่!
เครื่องมือคลาสสิกของ LudwigICT นี้ได้รับการออกแบบใหม่ โครงสร้างใหม่ และเปิดตัวใหม่ภายใต้แบรนด์นักพัฒนาของเราใหม่, PrimeQuant. รุ่นใหม่มีอินเทอร์เฟซที่เรียบง่ายและคุณสมบัติที่อัปเดตสำหรับสภาพตลาดปัจจุบัน รับรุ่นอัปเกรดในราคาพิเศษได้ที่นี่:
👉 Logarithmic Market Map Pro
👉 Logarithmic Market Map Pro
👉 Logarithmic Market Map Pro
⚠️ เราย้ายไปที่ 👉 PrimeQuant
(โปรดทราบ: รายการ LudwigICT ยังคงใช้งานได้สำหรับผู้ใช้เก่าแต่จะไม่ได้รับการอัปเดตหรือส่วนลดราคาอีกต่อไป)
🚀 แนะนำ Logarithmic Framework โดย LudwigICT 🚀
นำความเป็นระเบียบสู่ความวุ่นวายของตลาดด้วยเครื่องมือกราฟมืออาชีพที่ออกแบบมาสำหรับเทรดเดอร์ที่ต้องการโครงสร้าง ความชัดเจน และความแม่นยำ
✨ คุณสมบัติหลัก:
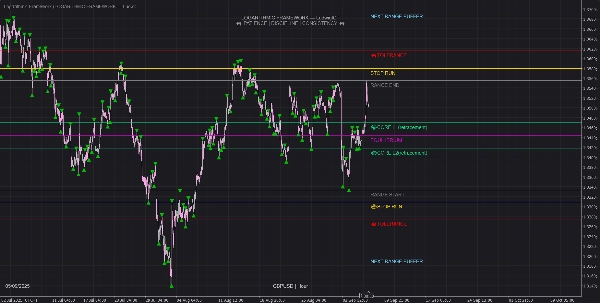
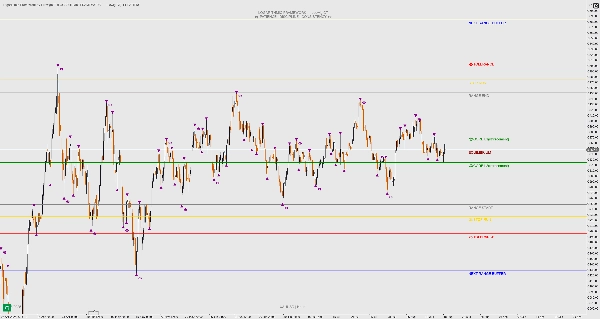
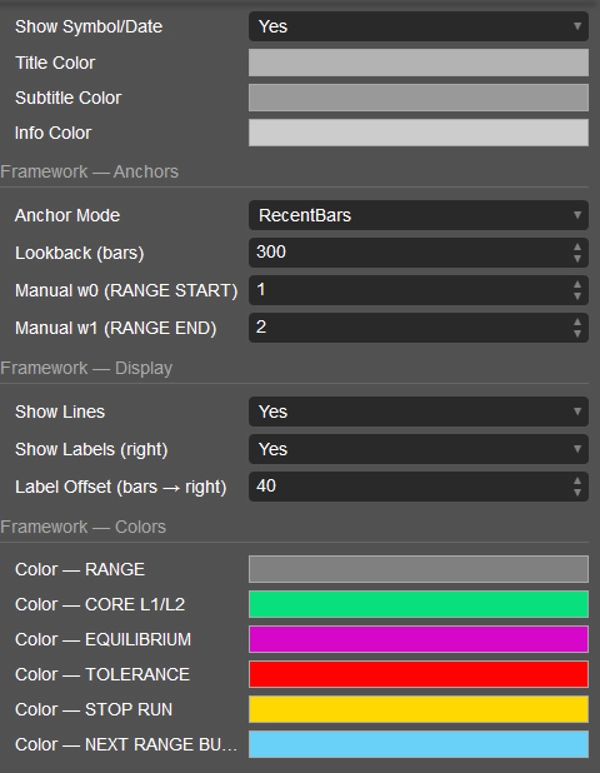
🔹 กริดโครงสร้างลอการิทึม – โซนสภาพคล่องอัตโนมัติ, สมดุล, และระดับหยุด-รันที่แม่นยำ
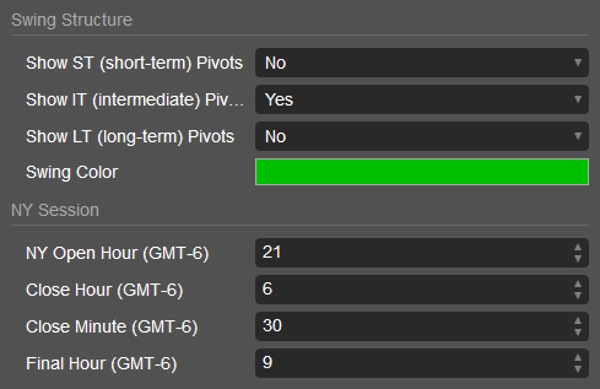
🔹 โครงสร้างตลาดหลายชั้น – จุดสวิงระยะสั้น, กลาง, และยาวสำหรับลำดับชั้นของการเคลื่อนไหวราคาอย่างชัดเจน
🔹 การทำแผนที่เซสชันนิวยอร์ก – เส้นเปิดจริง, ราคาสูง/ต่ำรายวัน, และเครื่องหมายเวลาของเซสชันสำหรับการเทรดสไตล์ ICT
🔹 ความงดงามทางสายตา – ลายน้ำ, ป้ายกำกับแบบไดนามิก, และเลย์เอาต์ที่สะอาดเพื่อให้กราฟของคุณคมชัดและเป็นมืออาชีพ
นี่ไม่ใช่แค่อินดิเคเตอร์ – มันคือ กรอบตลาดครบวงจร ที่ช่วยให้คุณมองเห็นการวิ่งของสภาพคล่อง, ติดตามการเปลี่ยนแปลงโครงสร้าง, และเทรดด้วยความมั่นใจในเซสชันที่สำคัญที่สุดของวัน
📊 ออกแบบมาสำหรับเทรดเดอร์ที่ต้องการ ความชัดเจนเหนือความยุ่งเหยิง.
เครื่องมือนี้สร้าง แผนที่โครงสร้างราคาและโซนสภาพคล่อง บนพื้นฐานกรอบลอการิทึม นอกจากนี้ยังติดตาม โครงสร้างตลาดสวิง ในหลายระดับเวลาและซ้อนทับ ไดนามิกของเซสชันนิวยอร์ก เป้าหมายคือช่วยให้คุณสอดคล้องกับโครงสร้างราคาและระดับสภาพคล่องที่สูงขึ้นในเชิงภาพ ในขณะที่รักษากราฟของคุณให้เรียบร้อยและสม่ำเสมอ
หากคุณมีคำถามหรือพบปัญหาใด ๆ โปรดติดต่อฉัน ยินดีช่วยเหลือคุณ!
ข้อจำกัดความรับผิดชอบ:
โดยการใช้สูตรของฉัน คุณรับทราบว่าการเทรดมีความเสี่ยงโดยธรรมชาติและผลการดำเนินงานในอดีตไม่รับประกันผลลัพธ์ในอนาคต จำเป็นอย่างยิ่งที่คุณต้องมีแผนการจัดการความเสี่ยงที่มั่นคง และเหนือสิ่งอื่นใด คุณต้องมีวินัยในการปฏิบัติตามระดับหยุดขาดทุนอย่างเคร่งครัด การไม่จัดการความเสี่ยงอย่างถูกต้องอาจนำไปสู่การขาดทุนอย่างมีนัยสำคัญ ฉันไม่รับผิดชอบต่อผลลัพธ์ทางการเงินใด ๆ ที่เกิดจากการใช้สูตรเหล่านี้ เทรดอย่างมีความรับผิดชอบและปฏิบัติตามแนวทางการจัดการความเสี่ยงอย่างถูกต้องเสมอ
ขอให้โชคดี! 🙌
สรุป
รีวิวจากลูกค้า
5 | 67 % | |
4 | 33 % | |
3 | 0 % | |
2 | 0 % | |
1 | 0 % |


