
คำอธิบาย
⚠️ เราย้ายไปที่ 👉 PrimeQuant
🚫🚫🚫 อย่าซื้ออินดิเคเตอร์นี้!
🎯 ภาพรวม
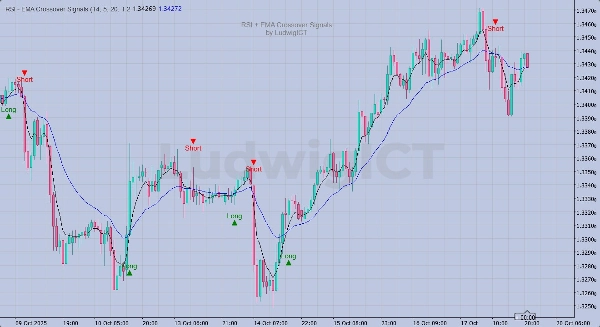
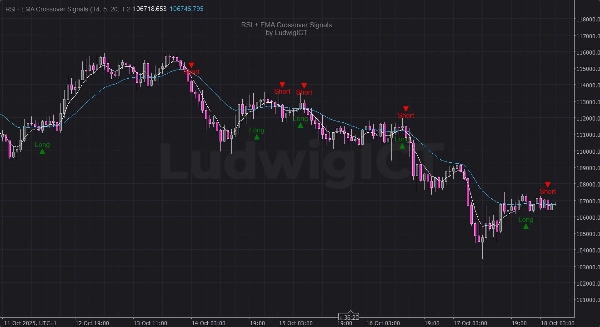
อินดิเคเตอร์ RSI + EMA Crossover Signals โดย LudwigICT รวม โมเมนตัม และ การยืนยันแนวโน้ม เพื่อสร้างสัญญาณซื้อขาย Long/Short ที่มีความน่าเชื่อถือสูง — โดยตรงบนกราฟของคุณ
⚙️ วิธีการทำงาน:
- ขั้นตอนสัญญาณ RSI:
-
- สัญญาณจะ เตรียมพร้อม เมื่อ RSI ตัดผ่านเส้นสัญญาณ SMA ของตัวเอง
- ขั้นตอนยืนยัน EMA:
-
- สัญญาณจะ ถูกกระตุ้น ก็ต่อเมื่อ EMA แบบเร็วและช้า ตัดกันในทิศทางเดียวกัน
- การยกเลิกสัญญาณ:
-
- การตัดกันในทิศทางตรงกันข้ามใดๆ (RSI หรือ EMA) จะยกเลิกสัญญาณที่ยังไม่ถูกกระตุ้น
✨ คุณสมบัติหลัก:
- 🔁 ตรรกะยืนยันคู่ (RSI + EMA)
- 📈 ไอคอน Long และ Short ที่ชัดเจน แสดงบนกราฟโดยตรง
- ⚡ การเลื่อนตำแหน่งแบบไดนามิกโดยใช้ ATR (ปรับอัตโนมัติตามความผันผวน)
- 💧 การซ้อนทับที่สะอาดพร้อมลายน้ำแบรนด์ถาวร
- 🧠 ตรรกะ “เตรียมพร้อม” และ “ยกเลิก” อัจฉริยะเพื่อลดการกระตุ้นผิดพลาด
- 🧮 ปรับแต่งพารามิเตอร์ RSI, EMA และการเลื่อนตำแหน่งได้เต็มที่
🔧 อินพุต:
- ช่วง RSI (ค่าเริ่มต้น: 14)
- EMA แบบเร็ว (ค่าเริ่มต้น: 5)
- EMA แบบช้า (ค่าเริ่มต้น: 20)
- การเลื่อนสัญญาณ (ตัวคูณ ATR, ค่าเริ่มต้น: 1.2)
📊 เหมาะสำหรับ:
- เทรดเดอร์โมเมนตัม
- ระบบยืนยันแนวโน้ม
- กลยุทธ์การเทรดด้วยตนเองหรือกึ่งอัตโนมัติ
📅 การอัปเดตเวอร์ชัน:
- ✅ เพิ่มการเลื่อนตำแหน่งแบบไดนามิกโดยใช้ ATR เพื่อภาพที่ชัดเจนขึ้น
- ✅ ปรับปรุงตรรกะความแม่นยำของสัญญาณ
- ✅ เพิ่มลายน้ำที่ไม่สามารถลบได้เพื่อความน่าเชื่อถือ
© 2025 LudwigICT — สงวนลิขสิทธิ์ทั้งหมด.
หากคุณมีคำถามหรือติดปัญหาใดๆ โปรดติดต่อฉันได้เลย ยินดีช่วยเหลือคุณ!
ข้อจำกัดความรับผิดชอบ:
โดยการใช้สูตรของฉัน คุณรับทราบว่าการเทรดมีความเสี่ยงโดยธรรมชาติและผลการดำเนินงานในอดีตไม่ได้รับประกันผลลัพธ์ในอนาคต สิ่งสำคัญคือคุณต้องมีแผนบริหารความเสี่ยงที่มั่นคง และเหนือสิ่งอื่นใด คุณต้องมีวินัยในการปฏิบัติตามระดับหยุดขาดทุนอย่างเคร่งครัด การไม่จัดการความเสี่ยงอย่างถูกต้องอาจนำไปสู่การขาดทุนอย่างมีนัยสำคัญ ฉันไม่รับผิดชอบต่อผลลัพธ์ทางการเงินใดๆ ที่เกิดจากการใช้สูตรเหล่านี้ โปรดเทรดอย่างรับผิดชอบและปฏิบัติตามแนวทางการบริหารความเสี่ยงอย่างถูกต้องเสมอ
ขอให้โชคดี! 🙌
สรุป
รีวิวจากลูกค้า
5 | 0 % | |
4 | 100 % | |
3 | 0 % | |
2 | 0 % | |
1 | 0 % |


