
คำอธิบาย
⚠️ เราย้ายไปที่ 👉 PrimeQuant
🚫🚫🚫 อย่าซื้ออินดิเคเตอร์นี้!
⚡ เวอร์ชันรุ่นถัดไปพร้อมใช้งาน: เครื่องมือ LudwigICT คลาสสิกนี้ได้รับการออกแบบใหม่ โครงสร้างใหม่ และปล่อยใหม่ภายใต้แบรนด์นักพัฒนาของเราใหม่, PrimeQuant. เวอร์ชันใหม่มี UI ที่เรียบง่ายและคุณสมบัติที่อัปเดตสำหรับสภาพตลาดปัจจุบัน รับเวอร์ชันอัปเกรดในราคาลดพิเศษสำหรับผู้ใช้เก่าได้ที่นี่:
👉 Elliott Waves Auto Detection + Fibonacci
👉 Elliott Waves Auto Detection + Fibonacci
👉 Elliott Waves Auto Detection + Fibonacci
(โปรดทราบ: รายการ LudwigICT ยังคงใช้งานได้สำหรับผู้ใช้เก่าแต่จะไม่ได้รับการอัปเดตหรือส่วนลดราคาอีกต่อไป)
📈 Elliott Wave – Fibonacci Levels [LudwigICT]
🔥 ปลดล็อกพลังเต็มรูปแบบของ ทฤษฎี Elliott Wave ร่วมกับ การถอย Fibonacci แบบไดนามิก – ทั้งหมดนี้อัตโนมัติสำหรับคุณภายใน cTrader!
อินดิเคเตอร์นี้นำการนับคลื่นระดับมืออาชีพและโซน Fibonacci ที่แม่นยำมาสู่กราฟของคุณโดยตรง ทำให้ การทำนายแนวโน้มและการดำเนินการซื้อขายง่ายขึ้นกว่าที่เคย.
✨ คุณสมบัติหลัก
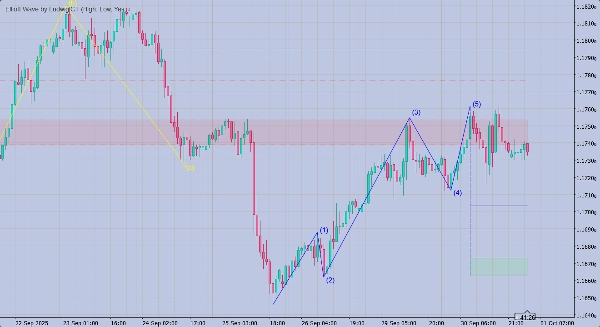
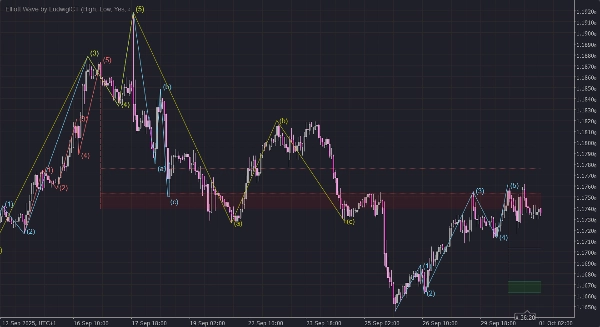
🔹 การตรวจจับคลื่นอัตโนมัติ
- ระบุ โครงสร้างคลื่นขับเคลื่อน 5 คลื่น (1–5).
- ตรวจจับ รูปแบบแก้ไข 3 คลื่น (A–B–C) ทันทีหลังจากคลื่นขับเคลื่อนเสร็จสิ้น.
🔹 การถอย Fibonacci แบบไดนามิก
- วางโซนถอยกลับสำคัญโดยอัตโนมัติ: 0.500 • 0.618 • 0.764 • 0.854.
- อัปเดตแบบเรียลไทม์ตามการพัฒนาของคลื่น.
- เน้นการยกเลิกด้วยเส้นประ.
🔹 กรอบงาน Multi-ZigZag
- ทำงาน การคำนวณ ZigZag อิสระสามชุด พร้อมความยาวและสีที่ปรับแต่งได้.
- รับประกันความไวที่ยืดหยุ่นสำหรับสภาพตลาดที่แตกต่างกัน.
🔹 ภาพมืออาชีพ
- ป้ายคลื่นที่สะอาด
(1)…(5)และ(a)(b)(c)วางด้วยการเลื่อนอัจฉริยะที่อิงตาม ATR. - กล่องเบรกเอาต์พร้อม เครื่องหมาย X หนา เมื่อระดับถูกทะลุ.
- พื้นที่เติม Fibonacci แบบไล่ระดับสีเพื่อการสังเกตง่าย.
🔹 ช่วยเหลือการซื้อขาย
- การระบุอัตโนมัติของ คลื่นใหม่ที่เป็นไปได้ (1) หลังการแก้ไข A–B–C.
- แจ้งเตือนเสียงสำหรับ คลื่นใหม่ การยกเลิก และสัญญาณเบรกเอาต์.
🛠 วิธีใช้
- นำไปใช้กับกราฟ
-
- เพียงลาก & วาง Elliott Wave – Fibonacci Levels [LudwigICT] ลงบนกราฟ cTrader ของคุณ.
- ใช้งานได้กับทุกกรอบเวลา (สแคลป์, สวิง, ระยะยาว).
- ปรับแต่งพารามิเตอร์
- อ่านคลื่น
-
- ✅ คลื่น
(1–5)= คลื่นขับเคลื่อน (ทิศทางแนวโน้ม). - 🔄 คลื่น
(a–b–c)= คลื่นแก้ไข (ทวนแนวโน้ม). - 📊 ระดับ Fibonacci แสดง โซนถอยกลับที่เป็นไปได้ สำหรับการเข้า/ออก.
- ✅ คลื่น
- ซื้อขายด้วยความมั่นใจ
-
- เข้าเทรดรอบๆ ระดับถอยกลับ Fibonacci หลังจากคลื่นขับเคลื่อนเสร็จสิ้น.
- จัดการความเสี่ยงเมื่อระดับถูกทำลาย (อินดิเคเตอร์แจ้งเตือนคุณโดยอัตโนมัติ).
- มองหาไอคอน คลื่นถัดไป (1) เพื่อคาดการณ์รอบแนวโน้มใหม่.
🎯 ทำไมต้องเลือกอินดิเคเตอร์นี้?
✅ ประหยัดเวลานับคลื่นด้วยตนเองหลายชั่วโมง.
✅ หลีกเลี่ยงข้อผิดพลาดเชิงอัตวิสัยในการวิเคราะห์ Elliott Wave.
✅ ภาพมืออาชีพที่สะอาดและแม่นยำบนกราฟของคุณโดยตรง.
✅ สร้างและปรับแต่งโดย LudwigICT ที่เชื่อถือได้ในระบบอัตโนมัติการซื้อขาย.
🖥 ความเข้ากันได้
- แพลตฟอร์ม: cTrader Desktop v5+
- เครื่องมือ: ใช้งานได้กับ Forex, หุ้น, ดัชนี, สินค้าโภคภัณฑ์, Crypto.
- กรอบเวลา: ตั้งแต่ สแคลป์ 1 นาที ถึง การวิเคราะห์สวิงรายสัปดาห์.
⚡️ เริ่มต้นเลย
🚀 เพิ่ม Elliott Wave – Fibonacci Levels [LudwigICT] ลงในอาวุธการซื้อขายของคุณวันนี้และยกระดับการวิเคราะห์กราฟของคุณ!
👉 เหมาะสำหรับเทรดเดอร์ที่พึ่งพา ราคาแอคชัน, โครงสร้าง และการถอย Fibonacci เพื่อจับเวลาการเข้าและออกอย่างแม่นยำ.
หากคุณมีคำถามหรือติดปัญหาใด ๆ โปรดติดต่อฉันได้เลย ฉันยินดีช่วยเหลือคุณ!
ข้อจำกัดความรับผิดชอบ:
โดยการใช้สูตรของฉัน คุณรับทราบว่าการซื้อขายมีความเสี่ยงโดยธรรมชาติและผลการดำเนินงานในอดีตไม่ได้รับประกันผลลัพธ์ในอนาคต สิ่งสำคัญคือคุณต้องมีแผนการจัดการความเสี่ยงที่มั่นคงและเหนือสิ่งอื่นใดคือคุณต้องมีวินัยในการปฏิบัติตามระดับหยุดขาดทุนอย่างเคร่งครัด การไม่จัดการความเสี่ยงอย่างเหมาะสมอาจนำไปสู่การสูญเสียอย่างมีนัยสำคัญ ฉันไม่รับผิดชอบต่อผลลัพธ์ทางการเงินใด ๆ ที่เกิดจากการใช้สูตรเหล่านี้ โปรดซื้อขายอย่างรับผิดชอบและปฏิบัติตามหลักการจัดการความเสี่ยงอย่างถูกต้องเสมอ.
ขอให้โชคดี! 🙌
สรุป
รีวิวจากลูกค้า
5 | 100 % | |
4 | 0 % | |
3 | 0 % | |
2 | 0 % | |
1 | 0 % |


