
Head Shoulders Finder
อินดิเคเตอร์
448 ดาวน์โหลด
เวอร์ชัน 1.0, May 2025
Windows, Mac
5.0
รีวิว: 1
คำอธิบาย
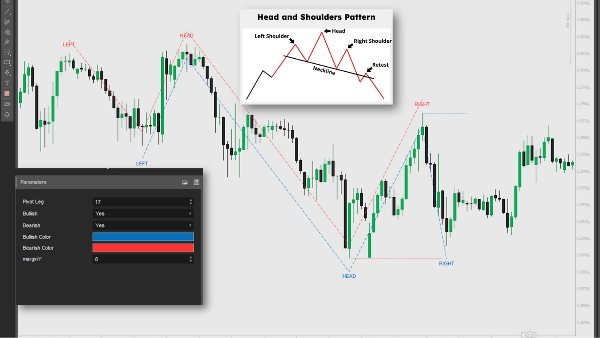
ตัวบ่งชี้นี้ระบุรูปแบบหัวและไหล่และหัวและไหล่กลับหัวโดยการวิเคราะห์จุดสูงสุดและต่ำสุดของราคาข้อมูล มันวาดเส้น ป้ายชื่อ และสัญญาณสำหรับการกลับตัวของแนวโน้มที่เป็นไปได้ โดยจะเปิดสถานะขายเมื่อราคาตัดผ่านเส้นคอด้านล่าง (แนวโน้มขาลง) หรือเปิดสถานะซื้อเมื่อราคาสูงกว่า (แนวโน้มขาขึ้น) เทรดเดอร์สามารถใช้สัญญาณเหล่านี้เพื่อเข้าเปิดสถานะขายหรือซื้อ โดยผสมผสานกับการวิเคราะห์อื่น ๆ และการบริหารความเสี่ยงเพื่อเพิ่มประสิทธิภาพกลยุทธ์การเทรด
สรุป
สรุปโดย AI
The Head Shoulders Finder is a technical indicator designed to detect Head and Shoulders and Inverted Head and Shoulders chart patterns by analyzing pivot highs and lows in price data. It visually marks these patterns with lines and labels on the price chart, highlighting potential trend reversal points. The indicator generates trading signals by identifying when the price crosses the neckline: a break below signals a bearish trend reversal suitable for short positions, while a break above indicates a bullish reversal for long positions. Traders can use these signals alongside other technical analyses and risk management strategies to inform entry decisions. This tool supports pattern recognition and signal plotting to assist in identifying potential trading opportunities based on classic reversal formations.
โปรไฟล์อินดิเคเตอร์
รีวิวจากลูกค้า
5.0
รีวิว: 1
5 | 100 % | |
4 | 0 % | |
3 | 0 % | |
2 | 0 % | |
1 | 0 % |
รีวิวจากลูกค้า
August 18, 2025
Automatically detects Head & Shoulders patterns, customizable visuals. Cons: No pattern reliability filter, no alerts, false signals on low TFs.
การสนทนา
คำถามที่พบบ่อย
ผลิตภัณฑ์ที่มีให้บริการผ่าน cTrader Store รวมถึงบอทการเทรด อินดิเคเตอร์ และปลั๊กอิน มีให้บริการโดยนักพัฒนาบุคคลที่สามและมีไว้เพื่อวัตถุประสงค์ในการเข้าถึงข้อมูลและทางเทคนิคเท่านั้น cTrader Store ไม่ใช่โบรกเกอร์และไม่ได้ให้คำแนะนำการลงทุน คำแนะนำส่วนบุคคล หรือการรับประกันผลการดำเนินงานในอนาคต
เพิ่มเติมจากผู้เขียนคนนี้


ราคา
86.67M
ปริมาณการเทรด
1.99M
Pips ที่ได้กำไร
3.67K
ติดตั้งฟรี