
Order Block Finder
อินดิเคเตอร์
1.91K ดาวน์โหลด
เวอร์ชัน 1.0, May 2025
Windows, Mac
5.0
รีวิว: 2
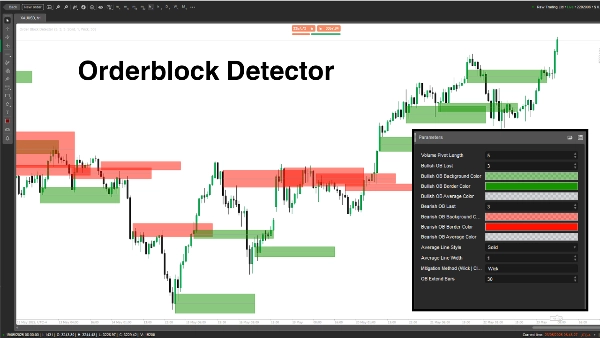
ตัวบ่งชี้ "Order Block Detector" ถูกสร้างขึ้นเพื่อระบุและแสดง Order Blocks (OBs) บนกราฟราคา—โซนสำคัญที่ผู้เล่นรายใหญ่ (สถาบัน) วางคำสั่งซื้อหรือขายจำนวนมาก ซึ่งมักจะกระตุ้นปฏิกิริยาราคาที่รุนแรง ช่วยให้นักเทรดสามารถระบุ โซนแนวรับ/แนวต้าน เพื่อการเข้าทำรายการที่ชาญฉลาดขึ้น การตั้งจุดหยุดขาดทุน หรือการทำกำไร
แนวคิด
- Order Blocks: คือโซนราคาที่ตลาดกลับตัวหรือหยุดชะงักเนื่องจากคำสั่งซื้อขายจากสถาบันจำนวนมาก ตัวบ่งชี้จะตรวจจับ OBs โดยการวิเคราะห์ จุดสูงสุดปริมาณ และสถานะตลาด (ขาขึ้น/ขาลง)
- วิธีการทำงาน:
-
- กำหนดสถานะตลาด (ขาขึ้น/ขาลง) โดยเปรียบเทียบจุดสูงสุด/ต่ำสุดกับช่วงเวลาย้อนหลัง (Length)
- ระบุ OBs ที่ จุดสูงสุดของปริมาณ ที่เชื่อมโยงกับระดับราคาสำคัญ
- วาดสี่เหลี่ยมและเส้นเฉลี่ยเพื่อทำเครื่องหมาย OBs พร้อมตรวจสอบและลบ OBs ที่ถูกบรรเทา เมื่อราคาทะลุผ่าน
- กรณีการใช้งาน: นักเทรดสามารถใช้ OBs เป็นโซนที่มีความน่าจะเป็นสูงสำหรับการตั้งค่าการเทรด การจัดการความเสี่ยง หรือเป้าหมายกำไร
การแยกพารามิเตอร์
- ความยาวจุดสูงสุดปริมาณ (Length, ค่าเริ่มต้น: 5, ขั้นต่ำ: 1)
-
- หน้าที่: กำหนดช่วงเวลาย้อนหลัง (จำนวนแท่งเทียน) สำหรับการคำนวณจุดสูงสุด/ต่ำสุดและจุดสูงสุดปริมาณ
- เหตุผลที่สำคัญ: ความยาวที่มากขึ้นเพิ่มความแม่นยำแต่ลดความถี่ของ OB; ความยาวที่สั้นกว่าจะจับ OB ได้มากขึ้นแต่มีเสียงรบกวนมากขึ้น
- OB ขาขึ้นล่าสุด (BullExtLast, ค่าเริ่มต้น: 3, ขั้นต่ำ: 1)
-
- หน้าที่: จำกัดจำนวน OB ขาขึ้นที่เก็บและติดตาม
- เหตุผลที่สำคัญ: จำกัดจำนวน OB ขาขึ้นที่แสดงเพื่อให้กราฟสะอาดและเพิ่มประสิทธิภาพ
- สีพื้นหลัง OB ขาขึ้น (BgBullCss, ค่าเริ่มต้น: #80169400)
-
- หน้าที่: กำหนดสีพื้นหลังและความโปร่งใสของสี่เหลี่ยม OB ขาขึ้น
- เหตุผลที่สำคัญ: ช่วยให้แยกแยะ OB ขาขึ้นบนกราฟได้ง่ายขึ้น
- สีขอบ OB ขาขึ้น (BullCss, ค่าเริ่มต้น: #169400)
-
- หน้าที่: กำหนดสีขอบของสี่เหลี่ยม OB ขาขึ้น
- เหตุผลที่สำคัญ: เพิ่มความชัดเจนของโซน OB ขาขึ้น
- สีเฉลี่ย OB ขาขึ้น (BullAvgCss, ค่าเริ่มต้น: #609598A1)
-
- หน้าที่: กำหนดสีเส้นเฉลี่ยภายใน OB ขาขึ้น
- เหตุผลที่สำคัญ: ทำเครื่องหมายจุดกึ่งกลางของ OB ซึ่งเป็นระดับอ้างอิงสำคัญสำหรับนักเทรด
- OB ขาลงล่าสุด (BearExtLast, ค่าเริ่มต้น: 3, ขั้นต่ำ: 1)
-
- หน้าที่: จำกัดจำนวน OB ขาลงที่เก็บและติดตาม
- เหตุผลที่สำคัญ: เช่นเดียวกับ BullExtLast ช่วยให้กราฟไม่รกโดยจำกัด OB ขาลง
- สีพื้นหลัง OB ขาลง (BgBearCss, ค่าเริ่มต้น: #80FF1100)
-
- หน้าที่: กำหนดสีพื้นหลังและความโปร่งใสของสี่เหลี่ยม OB ขาลง
- เหตุผลที่สำคัญ: แยกความแตกต่างระหว่าง OB ขาลงกับ OB ขาขึ้น
- สีขอบ OB ขาลง (BearCss, ค่าเริ่มต้น: #FF1100)
-
- หน้าที่: กำหนดสีขอบของสี่เหลี่ยม OB ขาลง
- เหตุผลที่สำคัญ: ทำให้ OB ขาลงโดดเด่นเพื่อการระบุอย่างรวดเร็ว
- สีเฉลี่ย OB ขาลง (BearAvgCss, ค่าเริ่มต้น: #609598A1)
-
- หน้าที่: กำหนดสีเส้นเฉลี่ยภายใน OB ขาลง
- เหตุผลที่สำคัญ: เน้นระดับราคากลางของ OB ขาลงเพื่อการวางแผนการเทรด
- สไตล์เส้นเฉลี่ย (LineStyle, ค่าเริ่มต้น: Solid)
-
- หน้าที่: กำหนดสไตล์ของเส้นเฉลี่ย OB (ทึบ, ขีด, จุด)
- เหตุผลที่สำคัญ: ปรับแต่งรูปลักษณ์ของเส้นเฉลี่ยให้เหมาะกับความชอบของนักเทรด
- ความกว้างเส้นเฉลี่ย (LineWidth, ค่าเริ่มต้น: 1, ขั้นต่ำ: 1)
-
- หน้าที่: ปรับความหนาของเส้นเฉลี่ย OB
- เหตุผลที่สำคัญ: ควบคุมความโดดเด่นของเส้นเฉลี่ยบนกราฟ
- วิธีการบรรเทา (Mitigation, ค่าเริ่มต้น: "Wick")
-
- หน้าที่: กำหนดวิธีการที่ OB ถูกยกเลิกความถูกต้อง:
-
- Wick: ใช้ราคาต่ำสุด (OB ขาขึ้น) หรือราคาสูงสุด (OB ขาลง) เพื่อตรวจสอบการบรรเทา
- Close: ใช้ราคาปิดเพื่อตรวจสอบการบรรเทา
- เหตุผลที่สำคัญ: มีผลต่อความไวของตัวบ่งชี้ต่อการที่ราคาทะลุโซน OB ซึ่งส่งผลต่อเวลาที่ OB ถูกลบออก
Order Block Detector เป็นเครื่องมือที่ทรงพลังสำหรับการระบุโซนคำสั่งซื้อขายของสถาบันโดยอิงจากการเพิ่มขึ้นของปริมาณและการเคลื่อนไหวของราคา มันวาดสี่เหลี่ยม OB ที่ชัดเจนพร้อมเส้นเฉลี่ยและลบ OB ที่ไม่ถูกต้องออกอย่างไดนามิก นักเทรดสามารถปรับพารามิเตอร์เพื่อปรับแต่งการตรวจจับ การแสดงผล และการจัดการ OB ให้เหมาะสมกับสไตล์การเทรดของตน
โปรไฟล์อินดิเคเตอร์
5.0
รีวิว: 2
5 | 100 % | |
4 | 0 % | |
3 | 0 % | |
2 | 0 % | |
1 | 0 % |
รีวิวจากลูกค้า
December 18, 2025
THIS IS BY FAR THE BEST TOOL for OB's - as a beginner I can visually see where I am and Where I need to go - THANK YOU SO MUCH
August 12, 2025
Pros: Automatically identifies bullish and bearish order blocks based on swing breakouts with clear zones. Useful for visual SMC analysis. Cons: No alerts or tooltips. Lacks template saving and volume confirmation features. Slight delay under heavy chart load.
ผลิตภัณฑ์ที่มีให้บริการผ่าน cTrader Store รวมถึงบอทการเทรด อินดิเคเตอร์ และปลั๊กอิน มีให้บริการโดยนักพัฒนาบุคคลที่สามและมีไว้เพื่อวัตถุประสงค์ในการเข้าถึงข้อมูลและทางเทคนิคเท่านั้น cTrader Store ไม่ใช่โบรกเกอร์และไม่ได้ให้คำแนะนำการลงทุน คำแนะนำส่วนบุคคล หรือการรับประกันผลการดำเนินงานในอนาคต
เพิ่มเติมจากผู้เขียนคนนี้


!["[Hamster-Coder] Price" โลโก้](https://cdn.ctrader.com/image/webp/893fb641-d5b3-44d8-91fb-6a2dc6f3d309_30647)


86.17M
ปริมาณการเทรด
1.91M
Pips ที่ได้กำไร
3.57K
ติดตั้งฟรี