
Time Marker
Wskaźnik
402 pobrania
Wersja 1.0, May 2025
Windows, Mac
Opis
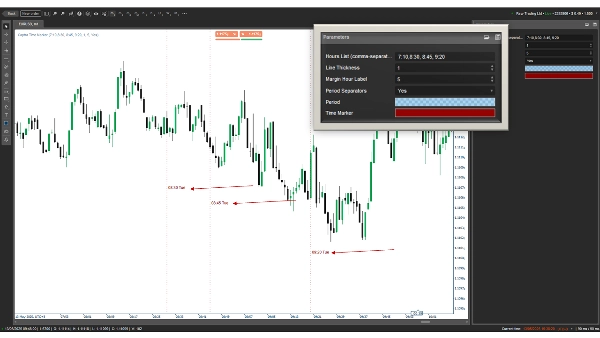
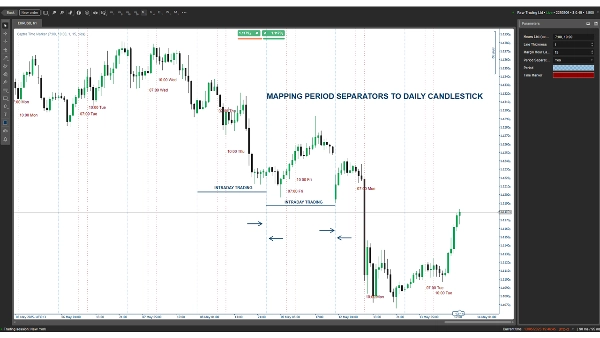
Captra Time Marker wzbogaca Twoje doświadczenie z cTrader, wizualnie oznaczając zdefiniowane przez użytkownika czasy (np. 7:10, 8:30) przerywanymi pionowymi liniami i oznaczonym tekstem (np. "07:10 Pon"). Idealne dla traderów skupiających się na określonych godzinach rynkowych, obsługuje konfigurowalne wejścia czasowe, grubość linii oraz pozycjonowanie etykiet. Opcjonalne dzienne separatory okresów podkreślają rozpoczęcia sesji, z możliwością konfiguracji kolorów i stylów. Doskonałe dla skalperów, day traderów oraz osób potrzebujących precyzyjnej analizy opartej na czasie. Łatwe do ustawienia, lekkie i kompatybilne ze wszystkimi interwałami czasowymi.
Podsumowanie
Podsumowanie AI
Time Marker is an indicator for cTrader that visually marks user-defined times on trading charts with dashed vertical lines and labeled text (e.g., "07:10 Mon"). It allows traders to specify exact times of interest, customize line thickness, and adjust label positioning. The indicator also offers optional daily period separators to highlight session starts, with configurable colors and styles. Designed for scalpers, day traders, and those requiring precise time-based analysis, it is lightweight, easy to set up, and compatible with all timeframes.
Profil wskaźnika
Opinie klientów
0.0
Opinie: 0
Opinie klientów
Ten produkt nie ma jeszcze opinii. Wypróbowałeś(-aś) go już? Bądź pierwszy(-a) i powiedz o tym innym!
Dyskusja
Częste pytania
Produkty dostępne za pośrednictwem cTrader Store, w tym boty handlowe, wskaźniki i wtyczki, dostarczane są przez deweloperów zewnętrznych i udostępniane wyłącznie w celach informacyjnych oraz w celu zapewnienia dostępu technicznego. cTrader Store nie jest brokerem i nie zapewnia doradztwa inwestycyjnego, nie udziela spersonalizowanych rekomendacji ani nie gwarantuje przyszłych wyników.
Więcej od tego autora


![Logo „[CB] Pivot Points Pro”](https://cdn.ctrader.com/image/webp/43463c82-67b0-4f10-a4ba-901bba091d81_32594)


Cena
86.67M
Wolumen transakcji
1.99M
Zysk w pipsach
3.67K
Bezpłatne instalacje