
High TF Plotter
Wskaźnik
435 pobrania
Wersja 1.0, May 2025
Windows, Mac
4.6
Opinie: 3
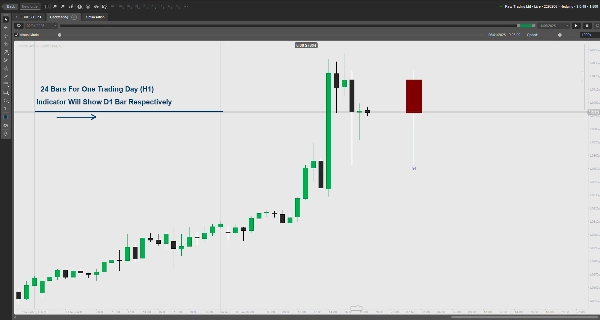
Wyświetla akcję cenową z wyższego TF na wykresach niższego TF. Pokazuje otwarcie/zamknięcie, knoty oraz kluczowe strefy z kolorami byków/niedźwiedzi. Możliwość dostosowania.
Kluczowe funkcje:
- Nakłada akcję cenową z wyższego interwału czasowego (np. dziennego) na wykresy z niższym interwałem.
- Wyświetla prostokąty cen otwarcia/zamknięcia z możliwością dostosowania kolorów byków/niedźwiedzi.
- Podkreśla strefy premii/zniżki knotów dla kluczowych poziomów cenowych.
- Konfigurowalny margines dla odstępów na wykresie.
- Obsługa błędów dla nieprawidłowych ustawień interwału czasowego.
Prosimy o pozostawienie recenzji, aby dać nam znać, czy jest pomocne.
Profil wskaźnika
4.6
Opinie: 3
5 | 67 % | |
4 | 33 % | |
3 | 0 % | |
2 | 0 % | |
1 | 0 % |
Opinie klientów
January 27, 2026
It would have been very helpful if it were possible to configure the time for NY EST
August 18, 2025
Clear higher timeframe level plotting, customizable, lightweight. Cons: No auto-labels, no multi-timeframe overlays, no alerts.
May 29, 2025
Muito bom, mas se tivesse a linha de abertura, máxima e mínima seria perfeito. Obrigada.
Produkty dostępne za pośrednictwem cTrader Store, w tym boty handlowe, wskaźniki i wtyczki, dostarczane są przez deweloperów zewnętrznych i udostępniane wyłącznie w celach informacyjnych oraz w celu zapewnienia dostępu technicznego. cTrader Store nie jest brokerem i nie zapewnia doradztwa inwestycyjnego, nie udziela spersonalizowanych rekomendacji ani nie gwarantuje przyszłych wyników.
Więcej od tego autora


86.17M
Wolumen transakcji
1.91M
Zysk w pipsach
3.57K
Bezpłatne instalacje