
MACD x Volume Profile
Gösterge
Sürüm 1.0, Jul 2026
Windows, Mac
Başlangıç 21/02/2026
17.43M
İşlem hacmi
2.85K
Kazanılan pip
1
Satışlar
Açıklama
MACD x Hacim Profili, cTrader (cAlgo) için özel bir üst üste binen göstergedir ve tüccarlara piyasa trendleri ve likidite hakkında çift yönlü bir bakış açısı sunmak üzere tasarlanmıştır. MACD göstergesinin temel unsurlarını dinamik bir Hacim Profili ile birleştirerek, kullanıcıların ana grafik üzerinde momentumu ve tarihsel fiyat kabul bölgelerini doğrudan analiz etmelerine olanak tanır.
Temel Özellikler:
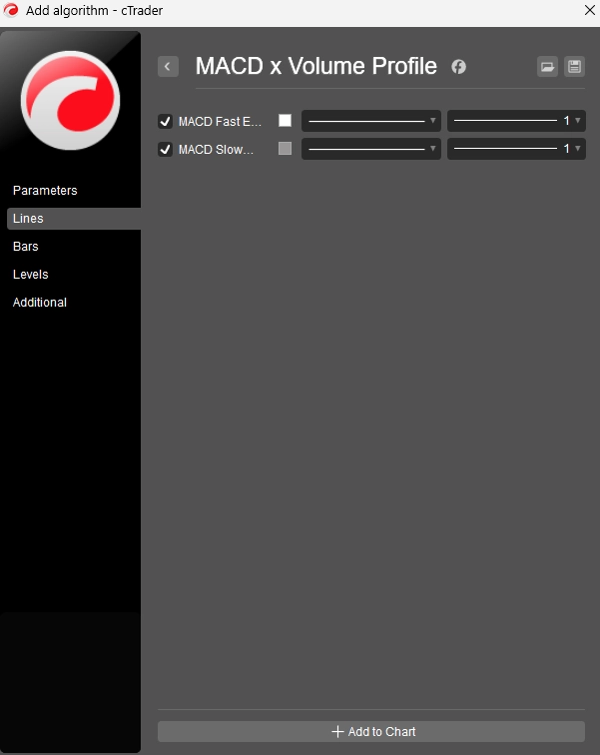
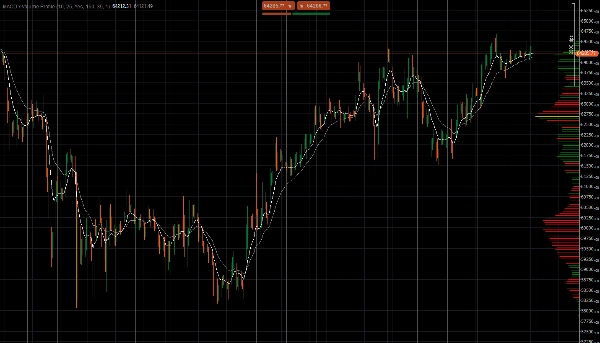
- Çift Üssel Hareketli Ortalamalar (EMA’lar): Fiyat grafiğinde doğrudan Hızlı EMA (varsayılan 10) ve Yavaş EMA (varsayılan 25) gösterir. Bu çizgilerin kesişimi ve ayrılması, kısa ve uzun vadeli trend yönü ile momentumu belirlemeye yardımcı olur ve standart MACD analizinin temelini oluşturur.
- Dinamik Görünür Aralık Hacim Profili (VRVP): Gösterge, yalnızca grafik üzerindeki şu anda görünen çubuklara dayalı olarak dinamik şekilde bir hacim profili hesaplar ve çizer. Kaydırma, yakınlaştırma veya pencere boyutunu değiştirme işlemlerinde otomatik olarak yeniden hesaplar ve ayarlar.
- Kontrol Noktası (POC) Vurgulaması: En yüksek işlem hacmine sahip fiyat seviyesi (POC), daha kalın sarı bir çizgi ile belirgin şekilde vurgulanır ve böylece mevcut görünümünüzdeki en güçlü destek veya direnç alanını anında tanımlamanızı sağlar.
- Yönlü Hacim Renklendirmesi: Hacim çizgileri, alım veya satım baskısını göstermek için renk kodludur. Bir fiyat aralığında yükseliş mumları sırasında (Kapanış ≥ Açılış) daha fazla hacim yaşanmışsa, profil çizgisi yeşil renkle boyanır. Ayı hacmi baskınsa, çizgi kırmızı renkle boyanır.
Parametre Özelleştirmesi:
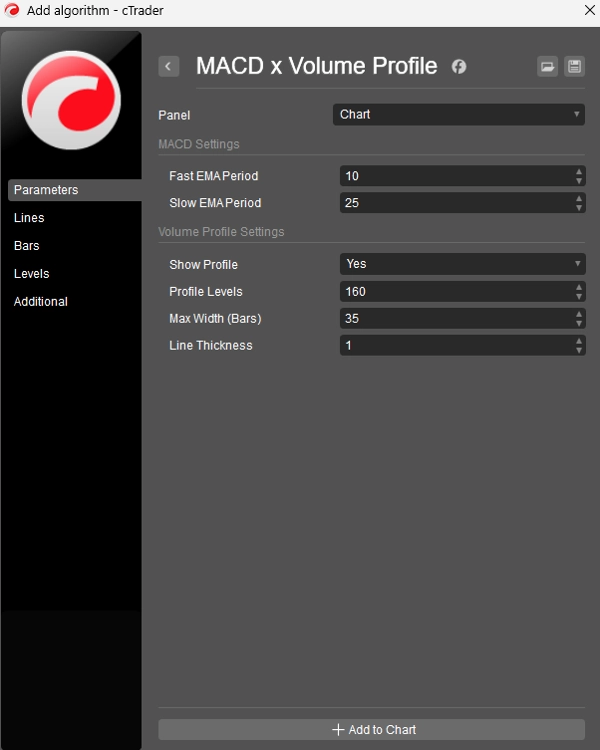
- MACD Ayarları: Hem Hızlı hem de Yavaş EMA’lar için tamamen ayarlanabilir periyotlar.
- Profil Düzeyi: Profil seviyeleri parametresi, hacim profilinin çözünürlüğünü (10’dan 200’e kadar fiyat bölmeleri arasında) ayarlamanıza olanak tanır.
- Görsel Ayarlamalar: Kullanıcılar, profilin görünürlüğünü açıp kapatabilir, ekran üzerindeki maksimum genişliğini ölçeklendirebilir ve çizgi kalınlığını ayarlayarak grafiği temiz ve görsel tercihlerine uygun hale getirebilir.
Özet
AI summary
The MACD x Volume Profile is a cTrader (cAlgo) overlay indicator that integrates the MACD's Fast and Slow Exponential Moving Averages (EMAs) with a dynamic Volume Profile on the main price chart. It displays a Fast EMA (default 10) and Slow EMA (default 25) to help identify trend direction and momentum through their crossings and separations. The Volume Profile dynamically calculates volume distribution based on the currently visible bars, updating automatically with chart navigation. The indicator highlights the Point of Control (POC)—the price level with the highest traded volume—using a distinct yellow line to mark key support or resistance zones. Volume bars are color-coded green or red to indicate buying or selling pressure, respectively. Users can customize MACD periods, adjust the granularity of the volume profile (10 to 200 price buckets), and modify visual settings such as profile visibility, width, and line thickness to suit their preferences. This tool combines momentum analysis with liquidity visualization to support trading decisions.
Gösterge profili
Gösterge kategorisi
Hacim
Çıktı türü
Görselleştirme
Veri gereklilikleri
Hacim
Desteklenen sinyaller
Trend gücü
Müşteri değerlendirmeleri
0.0
Değerlendirmeler: 0
Müşteri değerlendirmeleri
Bu ürün için henüz bir değerlendirme yok. Ürünü denediniz mi? O zaman ona dair görüşlerini paylaşan ilk kişi olun!
Tartışma
SSS
EMA
Volume
MACD
Moving Average
cTrader Store üzerinden erişilebilen işlem botları, göstergeler ve eklentiler gibi ürünler, üçüncü taraf sağlayıcılar tarafından sağlanır ve yalnızca bilgilendirme ve teknik erişim amaçlarıyla sunulur. cTrader Store bir broker değildir ve yatırım tavsiyesi, kişisel öneriler vermez veya gelecekteki performansı garanti etmez.
Bu oluşturanın diğer ürünleri






















Fiyat
Başlangıç 21/02/2026
17.43M
İşlem hacmi
2.85K
Kazanılan pip
1
Satışlar