Descripción
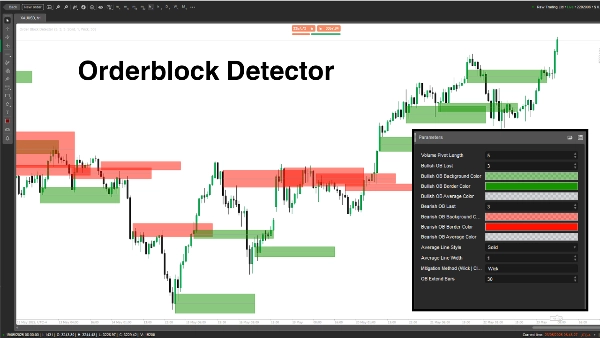
El indicador "Detector de Bloques de Orden" está diseñado para detectar y mostrar Bloques de Orden (BOs) en el gráfico de precios—zonas clave donde los grandes jugadores (instituciones) colocan órdenes significativas de compra o venta, a menudo desencadenando fuertes reacciones en el precio. Ayuda a los traders a identificar posibles zonas de soporte/resistencia para entradas de trading más inteligentes, stop-loss o take-profits.
Concepto
- Bloques de Orden: Son zonas de precio donde el mercado se revierte o pausa debido a un flujo intenso de órdenes institucionales. El indicador detecta los BOs analizando picos de volumen pivot y el estado del mercado (alcista/bajista).
- Cómo funciona:
-
- Determina el estado del mercado (alcista/bajista) comparando máximos/mínimos con un período de retroceso (Length).
- Identifica los BOs en picos de volumen vinculados a niveles clave de precio.
- Dibuja rectángulos y líneas promedio para marcar los BOs, mientras verifica y elimina BOs mitigados cuando el precio los atraviesa.
- Caso de uso: Los traders pueden usar los BOs como zonas de alta probabilidad para configuraciones de trading, gestión de riesgo o objetivos de ganancia.
Desglose de Parámetros
- Longitud del Pivote de Volumen (Length, Predeterminado: 5, Mín: 1)
-
- Qué hace: Establece el período de retroceso (número de barras) para calcular máximos/mínimos y picos de volumen pivot.
- Por qué importa: Una longitud mayor aumenta la precisión pero reduce la frecuencia de BOs; una longitud menor detecta más BOs pero puede incluir ruido.
- Último BO Alcista (BullExtLast, Predeterminado: 3, Mín: 1)
-
- Qué hace: Limita el número de BOs alcistas almacenados y rastreados.
- Por qué importa: Limita la cantidad de BOs alcistas mostrados para mantener el gráfico limpio y optimizar el rendimiento.
- Color de Fondo BO Alcista (BgBullCss, Predeterminado: #80169400)
-
- Qué hace: Establece el color de fondo y la transparencia de los rectángulos de BO alcistas.
- Por qué importa: Ayuda a distinguir visualmente los BOs alcistas en el gráfico.
- Color del Borde BO Alcista (BullCss, Predeterminado: #169400)
-
- Qué hace: Define el color del borde de los rectángulos de BO alcistas.
- Por qué importa: Mejora la visibilidad de las zonas de BO alcistas.
- Color Promedio BO Alcista (BullAvgCss, Predeterminado: #609598A1)
-
- Qué hace: Colorea la línea promedio dentro de los BOs alcistas.
- Por qué importa: Marca el punto medio del BO, sirviendo como nivel de referencia clave para los traders.
- Último BO Bajista (BearExtLast, Predeterminado: 3, Mín: 1)
-
- Qué hace: Limita el número de BOs bajistas almacenados y rastreados.
- Por qué importa: Al igual que BullExtLast, mantiene el gráfico despejado limitando los BOs bajistas.
- Color de Fondo BO Bajista (BgBearCss, Predeterminado: #80FF1100)
-
- Qué hace: Establece el color de fondo y la transparencia de los rectángulos de BO bajistas.
- Por qué importa: Diferencia los BOs bajistas de los alcistas.
- Color del Borde BO Bajista (BearCss, Predeterminado: #FF1100)
-
- Qué hace: Define el color del borde de los rectángulos de BO bajistas.
- Por qué importa: Hace que los BOs bajistas destaquen para una identificación rápida.
- Color Promedio BO Bajista (BearAvgCss, Predeterminado: #609598A1)
-
- Qué hace: Colorea la línea promedio dentro de los BOs bajistas.
- Por qué importa: Resalta el nivel central de precio de los BOs bajistas para la planificación del trading.
- Estilo de Línea Promedio (LineStyle, Predeterminado: Sólido)
-
- Qué hace: Establece el estilo de la línea promedio del BO (Sólido, Discontinuo, Punteado).
- Por qué importa: Personaliza la apariencia de la línea promedio para adaptarse a las preferencias del trader.
- Ancho de Línea Promedio (LineWidth, Predeterminado: 1, Mín: 1)
-
- Qué hace: Ajusta el grosor de la línea promedio del BO.
- Por qué importa: Controla qué tan prominente aparece la línea promedio en el gráfico.
- Método de Mitigación (Mitigation, Predeterminado: "Wick")
-
- Qué hace: Define cómo se invalidan los BOs:
-
- Wick: Usa el precio más bajo (BO alcista) o más alto (BO bajista) para verificar la mitigación.
- Close: Usa el precio de cierre para verificar la mitigación.
- Por qué importa: Afecta la sensibilidad del indicador a la ruptura de zonas BO, impactando cuándo se eliminan los BOs.
El Detector de Bloques de Orden es una herramienta poderosa para identificar zonas de órdenes institucionales basadas en picos de volumen y acción del precio. Dibuja rectángulos claros de BO con líneas promedio y elimina dinámicamente los invalidados. Los traders pueden ajustar parámetros para afinar la detección, visualización y gestión de BOs para que coincidan con su estilo de trading.
Resumen
The indicator works by analyzing volume pivot highs and determining market state (bullish or bearish) based on highs and lows over a configurable lookback period. It marks OBs with rectangles and average lines, dynamically removing those invalidated when price breaks through the zones. Users can customize parameters such as the lookback length, the number of bullish and bearish OBs tracked, colors and styles of OB rectangles and average lines, and the method used to detect OB mitigation (using wick or close prices).
This flexibility allows traders to tailor the detection and visualization of Order Blocks to their trading style, aiding in identifying high-probability zones for trade setups, risk management, and profit targeting.
Valoraciones de clientes
5 | 100 % | |
4 | 0 % | |
3 | 0 % | |
2 | 0 % | |
1 | 0 % |