
Compare Symbol
インジケーター
199 ダウンロード数
バージョン 1.0、May 2025
Windows、Mac
説明
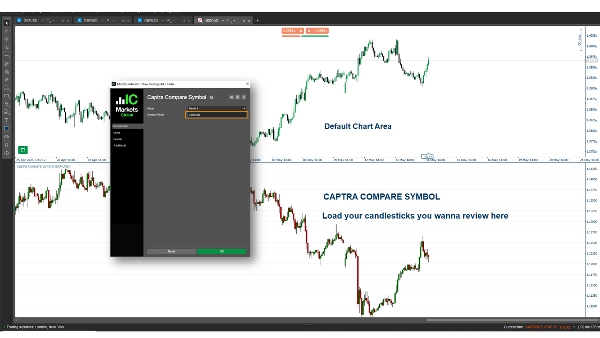
Captra Compare Symbol は、チャート上でEURUSDのような選択したシンボルの終値を表示し、ローソク足(ヒゲ、実体)を描画するcTraderインジケーターです。5分、15分、1時間、日足などのさまざまな時間枠に対応し、始値・終値・高値・安値を使用して正確に表現できるカスタマイズ可能なビジュアルを備えています。
概要
AIによる概要
Captra Compare Symbol is a cTrader indicator that visualizes price data of a selected trading symbol, such as EURUSD, directly on the chart. It plots the close price and renders candlesticks—including wicks and bodies—using open, high, low, and close prices for precise representation. The indicator supports multiple timeframes, including 5-minute, 15-minute, 1-hour, and daily intervals. Visual elements are customizable to fit user preferences. This tool enables traders to compare the price action of an additional symbol alongside their primary chart, facilitating multi-symbol analysis within the cTrader platform.
インジケーターのプロフィール
カスタマーレビュー
0.0
レビュー: 0
カスタマーレビュー
この商品にはまだレビューがありません。お使いになったことがある方は、ぜひレビューをお願いします。
ディスカッション
よくあるご質問
EURUSD
cTrader Storeで入手可能な取引ボット、インジケーター、プラグインなどの商品は、第三者の開発者が提供するものであり、情報と技術の取得のみを目的としてご利用いただけます。cTrader Storeはブローカーではなく、投資助言や個人的な推奨を行うことも、将来のパフォーマンスを保証することもありません。
この作成者の他の商品


価格
86.67M
取引数量
1.99M
獲得pips
3.66K
無料インストール