
ORB SMA
Indicador
184 descargas
Versión 1.0, Feb 2026
Windows, Mac
4.0
Valoraciones: 1
Descripción
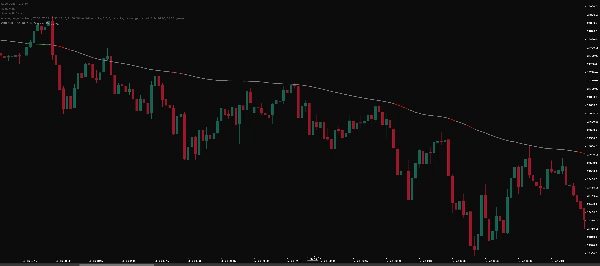
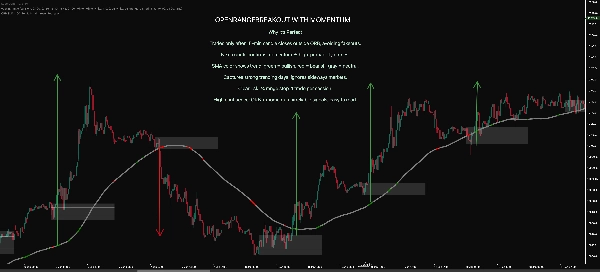
Breakout SMA por SLA es una herramienta de filtrado de tendencias diseñada para mejorar el marco ORB SLA.
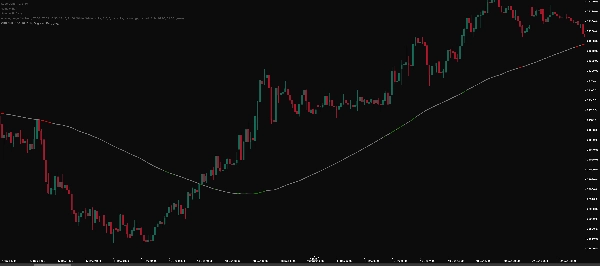
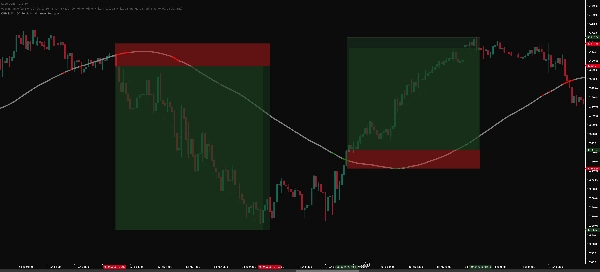
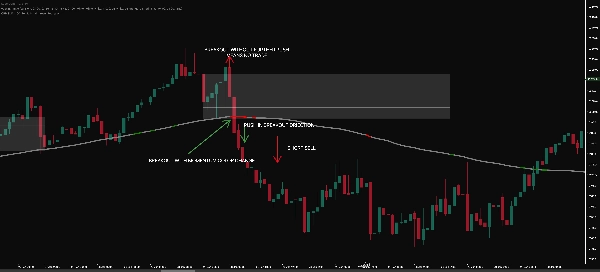
Funciona combinando la acción del precio con una SMA/SMMA direccional, rupturas de la Banda de Bollinger, y momentum RSI. El color de la línea cambia dinámicamente para indicar la probable dirección de la ruptura:
- 🟢 alcista
- 🔴 bajista
- ⚪ neutral
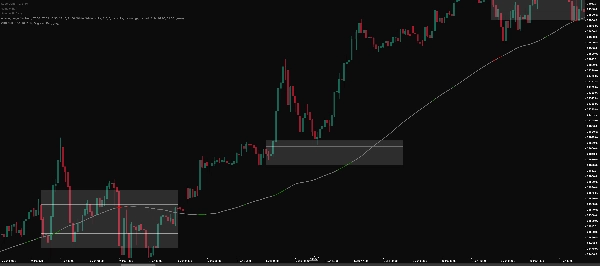
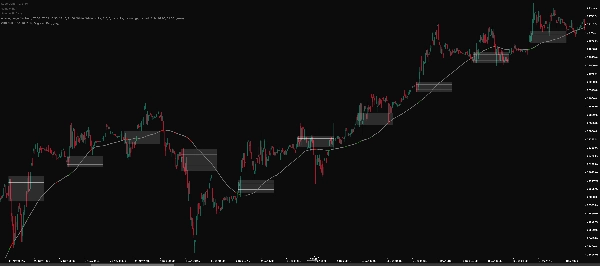
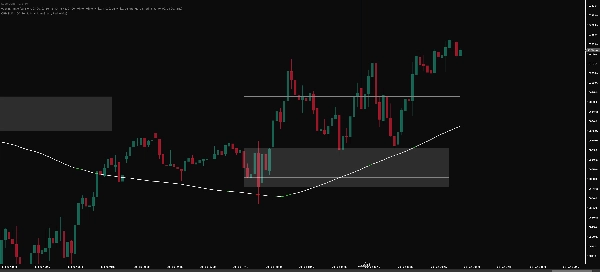
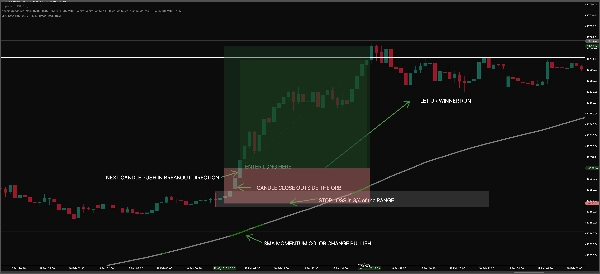
Las rupturas se confirman solo cuando el precio se alinea con la tendencia de la SMA, ayudando a filtrar movimientos falsos. La SMA también puede usarse para seguir tu stop-loss, permitiéndote gestionar las operaciones a lo largo de la tendencia en evolución.
Ideal para traders intradía disciplinados que buscan confirmaciones estructuradas de ORB, validación de momentum y señales visuales claras.
Resumen
Resumen de IA
ORB SMA is a trend-filtering indicator designed to enhance the ORB SLA trading framework. It integrates price action with a directional Simple Moving Average (SMA) or Smoothed Moving Average (SMMA), Bollinger Band breakouts, and Relative Strength Index (RSI) momentum to identify potential breakout directions. The indicator dynamically changes line color to signal bullish (green), bearish (red), or neutral (white) breakout conditions. Breakouts are confirmed only when the price movement aligns with the SMA trend, which helps filter out false signals. Additionally, the SMA can be used to trail stop-loss orders, aiding trade management along evolving trends. This tool is suitable for intraday traders seeking structured breakout confirmations, momentum validation, and clear visual cues across various markets including Forex, indices, commodities, stocks, and cryptocurrencies. It supports symbols such as BTCUSD, EURUSD, GBPUSD, NZDUSD, XAUUSD, USDJPY, and indices like NAS100 and FTSE100. The indicator incorporates multiple technical elements including RSI, Bollinger Bands, ATR, MACD, Supertrend, and VWAP to provide comprehensive trend and momentum analysis.
Perfil del indicador
Valoraciones de clientes
4.0
Valoraciones: 1
5 | 0 % | |
4 | 100 % | |
3 | 0 % | |
2 | 0 % | |
1 | 0 % |
Valoraciones de clientes
March 5, 2026
ORB SMA is a helpful trend filter designed to support ORB-style breakout trading. It combines SMA direction, Bollinger Band breakout logic and RSI momentum to confirm potential moves. The dynamic color change (bullish, bearish, neutral) makes market direction easy to read. A practical tool for traders looking to filter false breakouts and trade with trend confirmation.
Conversación
Preguntas frecuentes
BTCUSD
Forex
Breakout
Indices
EURUSD
Commodities
GBPUSD
NZDUSD
RSI
Bollinger
Prop
Supertrend
Crypto
Stocks
XAUUSD
NAS100
ATR
MACD
USDJPY
VWAP
Los productos disponibles a través de cTrader Store, incluidos bots, indicadores y plugins para operar, son proporcionados por desarrolladores de terceros y están disponibles únicamente con fines informativos y de acceso técnico. cTrader Store no es un bróker, por lo que no proporciona asesoramiento de inversión, recomendaciones personales ni ninguna garantía de rentabilidad futura.
Más de este autor


Precio
Desde 23/02/2025
1
Ventas
184
Instalaciones gratis