
Order Block Finder
インジケーター
1.91K ダウンロード数
バージョン 1.0、May 2025
Windows、Mac
5.0
レビュー: 2
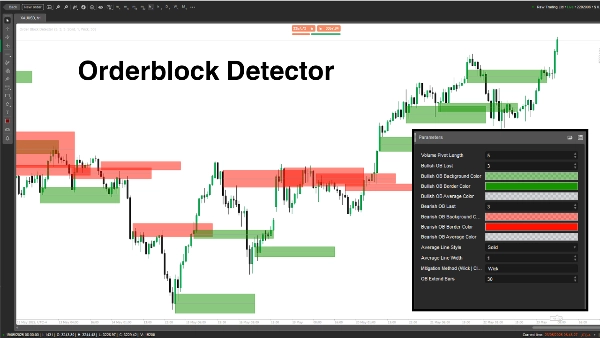
「オーダーブロックディテクター」インジケーターは、価格チャート上でオーダーブロック(OB)を検出・表示するために作られています。これは、大口プレイヤー(機関投資家)が重要な買いまたは売り注文を出す主要なゾーンであり、しばしば強い価格反応を引き起こします。トレーダーがより賢明な取引エントリー、ストップロス、または利益確定のための潜在的なサポート/レジスタンスゾーンを特定するのに役立ちます。
コンセプト
- オーダーブロック:これは、重い機関の注文フローにより市場が反転または一時停止する価格ゾーンです。インジケーターはボリュームピボット高値と市場状態(強気/弱気)を分析してOBを検出します。
- 動作原理:
-
- 高値/安値をルックバック期間(Length)と比較して市場状態(強気/弱気)を判断します。
- 主要な価格レベルに結びついたボリュームピークでOBを特定します。
- OBを示すために長方形と平均線を描画し、価格が突破した場合に緩和されたOBをチェックして削除します。
- 使用例:トレーダーはOBを高確率の取引セットアップ、リスク管理、または利益目標のゾーンとして利用できます。
パラメータの詳細
- ボリュームピボット長(Length、デフォルト:5、最小:1)
-
- 機能:高値/安値およびボリュームピボット高値を計算するためのルックバック期間(バー数)を設定します。
- 重要性:長い期間は精度を高めますがOBの頻度を減らし、短い期間はより多くのOBを捉えますがノイズが含まれる可能性があります。
- 強気OBの最大数(BullExtLast、デフォルト:3、最小:1)
-
- 機能:保存および追跡する強気OBの数を制限します。
- 重要性:表示される強気OBの数を制限してチャートを見やすくし、パフォーマンスを最適化します。
- 強気OB背景色(BgBullCss、デフォルト:#80169400)
-
- 機能:強気OBの長方形の背景色と透明度を設定します。
- 重要性:チャート上で強気OBを視覚的に区別するのに役立ちます。
- 強気OB境界色(BullCss、デフォルト:#169400)
-
- 機能:強気OBの長方形の境界色を定義します。
- 重要性:強気OBゾーンの視認性を高めます。
- 強気OB平均色(BullAvgCss、デフォルト:#609598A1)
-
- 機能:強気OB内の平均線の色を設定します。
- 重要性:OBの中間点を示し、トレーダーにとって重要な参照レベルとなります。
- 弱気OBの最大数(BearExtLast、デフォルト:3、最小:1)
-
- 機能:保存および追跡する弱気OBの数を制限します。
- 重要性:BullExtLastと同様に、チャートをすっきりさせるために弱気OBの数を制限します。
- 弱気OB背景色(BgBearCss、デフォルト:#80FF1100)
-
- 機能:弱気OBの長方形の背景色と透明度を設定します。
- 重要性:弱気OBを強気OBと区別します。
- 弱気OB境界色(BearCss、デフォルト:#FF1100)
-
- 機能:弱気OBの長方形の境界色を定義します。
- 重要性:弱気OBを目立たせ、迅速な識別を可能にします。
- 弱気OB平均色(BearAvgCss、デフォルト:#609598A1)
-
- 機能:弱気OB内の平均線の色を設定します。
- 重要性:弱気OBの中心価格レベルを強調し、取引計画に役立ちます。
- 平均線スタイル(LineStyle、デフォルト:Solid)
-
- 機能:OBの平均線のスタイル(実線、破線、点線)を設定します。
- 重要性:トレーダーの好みに合わせて平均線の見た目をカスタマイズします。
- 平均線の幅(LineWidth、デフォルト:1、最小:1)
-
- 機能:OB平均線の太さを調整します。
- 重要性:チャート上で平均線の目立ち具合を制御します。
- 緩和方法(Mitigation、デフォルト:「Wick」)
-
- 機能:OBが無効とされる方法を定義します:
-
- Wick:緩和をチェックするために、強気OBは最安値、弱気OBは最高値を使用します。
- Close:緩和をチェックするために終値を使用します。
- 重要性:価格がOBゾーンを突破した際のインジケーターの感度に影響し、OBが削除されるタイミングに影響を与えます。
オーダーブロックディテクターは、ボリュームの急増と価格の動きを基に機関の注文ゾーンを見つける強力なツールです。明確なOB長方形と平均線を描画し、無効になったものを動的に削除します。トレーダーはパラメータを調整して検出、表示、管理を細かく設定し、自分の取引スタイルに合わせることができます。
インジケーターのプロフィール
5.0
レビュー: 2
5 | 100 % | |
4 | 0 % | |
3 | 0 % | |
2 | 0 % | |
1 | 0 % |
カスタマーレビュー
December 18, 2025
THIS IS BY FAR THE BEST TOOL for OB's - as a beginner I can visually see where I am and Where I need to go - THANK YOU SO MUCH
August 12, 2025
Pros: Automatically identifies bullish and bearish order blocks based on swing breakouts with clear zones. Useful for visual SMC analysis. Cons: No alerts or tooltips. Lacks template saving and volume confirmation features. Slight delay under heavy chart load.
cTrader Storeで入手可能な取引ボット、インジケーター、プラグインなどの商品は、第三者の開発者が提供するものであり、情報と技術の取得のみを目的としてご利用いただけます。cTrader Storeはブローカーではなく、投資助言や個人的な推奨を行うことも、将来のパフォーマンスを保証することもありません。
この作成者の他の商品


![「[Stellar Strategies] Market Regime Filter」ロゴ](https://cdn.ctrader.com/image/webp/3bdeba11-7e8b-4e5f-9af9-d562f48df039_28423)


86.17M
取引数量
1.91M
獲得pips
3.57K
無料インストール