
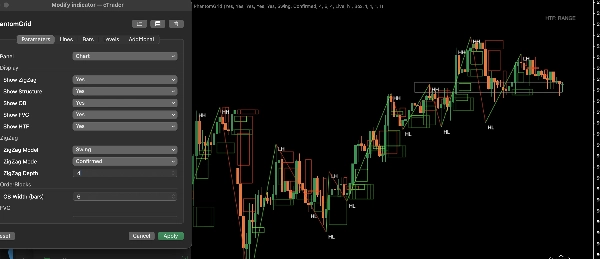
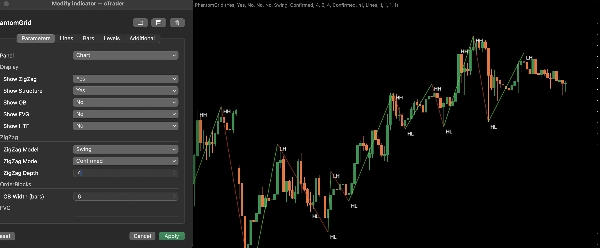
PhantomGrid é um indicador de visualização de grade de nível profissional projetado para trazer clareza, estrutura e precisão à análise da ação do preço.
Ele traça automaticamente níveis dinâmicos de grade em qualquer símbolo e período de tempo, ajudando os traders a identificar zonas de reação, refinar entradas e saídas, e planejar negociações com maior consistência.
PhantomGrid é construído tanto para traders discricionários quanto sistemáticos que desejam uma estrutura limpa e estruturada sem poluição desnecessária no gráfico. O indicador se adapta suavemente às condições de mercado em mudança, mantendo clareza visual e precisão em diferentes ambientes.
Principais Recursos
• Traçado automático de grade dinâmica em todos os símbolos e períodos de tempo
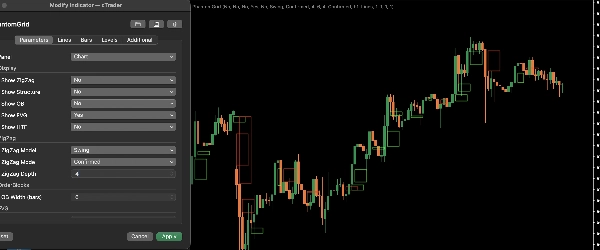
• Ajuda a identificar zonas de reação, áreas de liquidez e configurações estruturadas
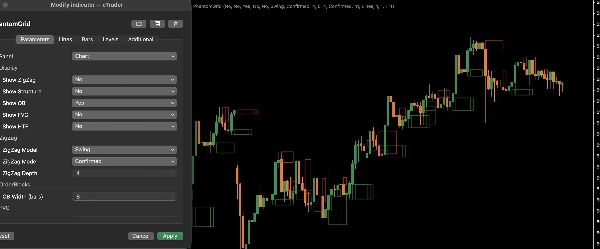
• Design visual limpo e minimalista para análise sem distrações
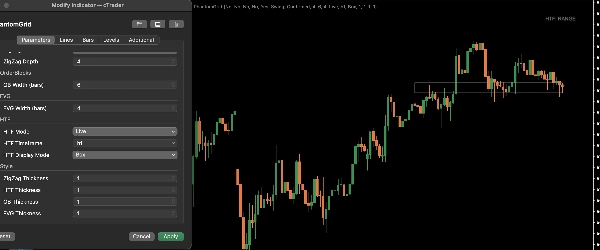
• Espaçamento, estilo e comportamento da grade totalmente personalizáveis
• Leve e otimizado para desempenho suave
• Adequado para fluxos de trabalho de scalping, intraday e swing trading
Como os Traders Usam o PhantomGrid
PhantomGrid ajuda os traders a:
• estruturar o movimento do mercado de forma mais clara
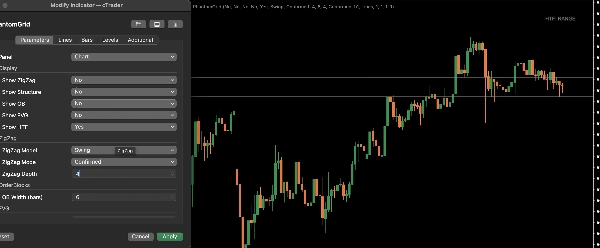
• identificar áreas de reação de alta probabilidade
• melhorar o timing para entradas e saídas
• gerenciar negociações de forma mais sistemática
• manter consistência entre instrumentos
Funciona efetivamente como uma ferramenta independente ou junto com estratégias e fluxos de trabalho existentes.
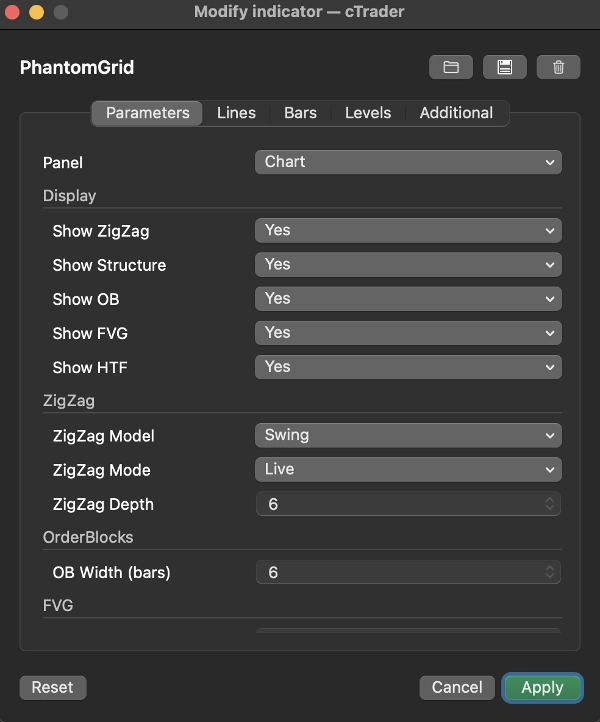
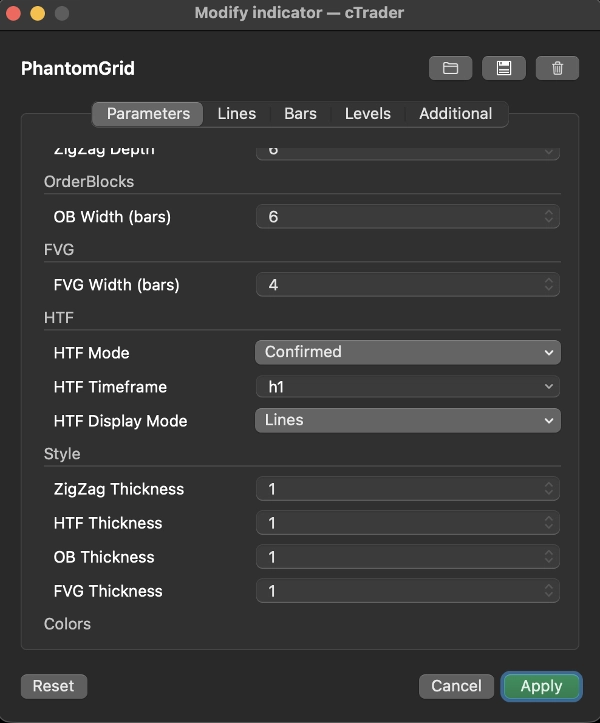
Opções de Personalização
PhantomGrid inclui configurações flexíveis para combinar com diferentes estilos de negociação:
• controles de espaçamento da grade
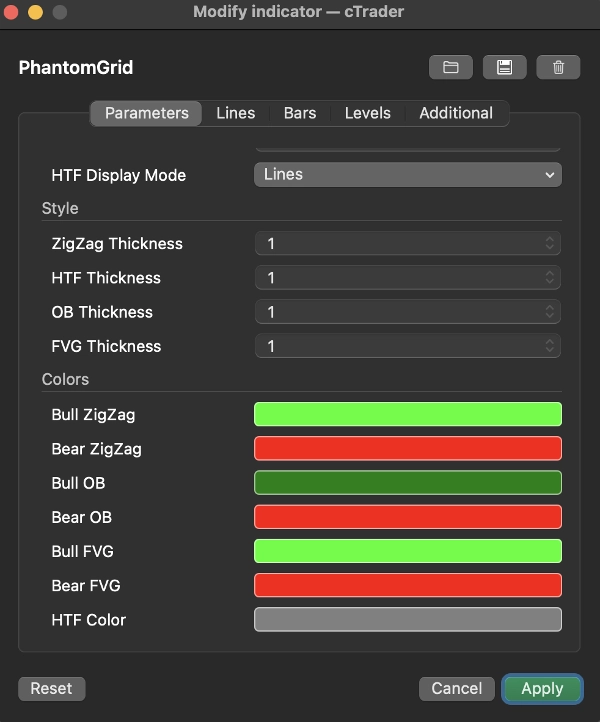
• configurações visuais de estilo e cor
• ajustes de visibilidade para layouts mais limpos
• ajuste de comportamento para diferentes condições de volatilidade
Essas opções permitem que os traders adaptem o indicador ao seu fluxo de trabalho e preferências exatas.
Desempenho e Compatibilidade
PhantomGrid é projetado para desempenho estável e eficiente e funciona suavemente em todos os símbolos e períodos de tempo suportados dentro do cTrader. O indicador se integra naturalmente em configurações profissionais de gráficos sem diminuir o desempenho da plataforma.
Inclui teste completo de 7 dias. Sem limitações.
Desempenho passado não garante resultados futuros. Este indicador é apenas para fins informativos e não constitui aconselhamento financeiro.
5 | 100 % | |
4 | 0 % | |
3 | 0 % | |
2 | 0 % | |
1 | 0 % |


