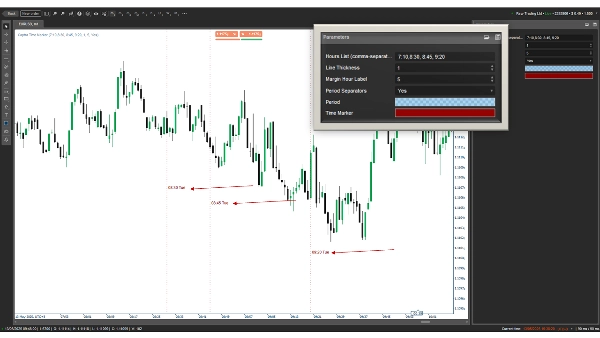
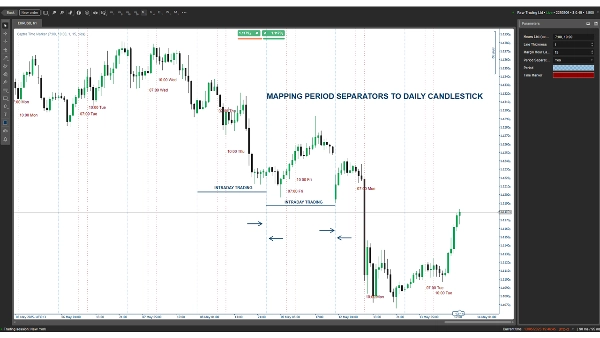
「Time Marker」ロゴ
Time Marker
「Time Marker」アップロード画像
82.18M
取引数量
1.64M
獲得pips
3.05K
無料インストール

Captra Time Marker enhances your cTrader experience by visually marking user-defined times (e.g., 7:10, 8:30) with dashed vertical lines and labeled text (e.g., "07:10 Mon"). Ideal for traders focusing on specific market hours, it supports customizable time inputs, line thickness, and label positioning. Optional daily period separators highlight session starts, with configurable colors and styles. Perfect for scalpers, day traders, and those needing precise time-based analysis. Easy to set up, lightweight, and compatible with all timeframes.

Indicator profile
0.0
レビュー: 0
カスタマーレビュー
この商品にはまだレビューがありません。お使いになったことがある方は、ぜひレビューをお願いします。
Products available through cTrader Store, including trading bots, indicators and plugins, are provided by third-party developers and made available for informational and technical access purposes only. cTrader Store is not a broker and does not provide investment advice, personal recommendations or any guarantee of future performance.

この作成者の他の商品

「Order Block Finder」ロゴ
5.0
(2)
無料
Order Block Detector is built to spot and display Order Blocks on chart, often triggering strong price reactions.
「High TF Plotter」ロゴ
4.6
(3)
無料
Captra High TF Plotter visualizes high timeframe Bar on lower timeframe charts, highlighting with bull/bear colors.
Detects Head & Shoulders patterns, plots signals, and alerts for trading opportunities.
cTrader indicator with mini-timeframe candlesticks. Customize timeframe, colors, margins. Perfect for traders.
Plots chosen symbol's close price, candlestick (wick, body) on cTrader chart, supports multiple timeframes.

これも好きかも

The "Daily Levels" indicator is used to display last week's and yestoday high/low price
Daily TPO profile indicator that calculates POC, VAH and VAL for each session. Plots the Point of Control and the 70% Va
The standard Relative Strength Index (RSI), RSI & Signal Cloud, Smart Volatility Filter (ATR), On-Chart Info Dashboard
📈 Trading Sessions Indicator — London, New York & Tokyo Visualize Key Market Sessions + High/Low Levels with Precision
DEMO VERSION 7 DAYS VolumeProfileSuite is an advanced and flexible Volume Profile indicator for cTrader.
BlocksLiquidity Indicator Analysis!
Perfect Trend
Pinpoint, highlight and lock market data easily
Volume Squeeze, real-time buying and selling.
A rectangular box with 5 adjustable Fibonacci level or even custom ones.
Advanced Volatility Suite - Institutional-Grade Volatility Forecasting
Enhance MACD Histogram! Visualize bull and bear price changes with vibrant colors for clearer, more insightful trading.
moving average cloud. you could change cloud color.
Color-Based Market Pressure & Volatility Visualizer The Kandika Heatmap Indicator
Draws Stoploss and Takeprofit levels based on the ATR indicator.
Automatic Wolfe Wave detection with full trade projection and performance dashboard for traders.
Free chart themes for the cTrader platform.
Allow trader to visualize Support & Resistance across different timeframes,give trader an overview of the current market
82.18M
取引数量
1.64M
獲得pips
3.05K
無料インストール