
Atlas Seasonal Returns Heatmap
インジケーター
3 購入済
バージョン 1.0、Sep 2025
Windows、Mac
4.5
レビュー: 2
説明
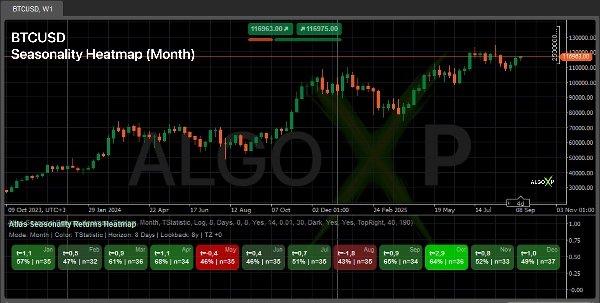
🧭 時計で取引のタイミングを計る:Atlasは市場が月別、曜日別、時間別に動く傾向を明らかにします。🧭
市場が動く傾向のある時期を確認しましょう — 月別、曜日別、または時間別で。
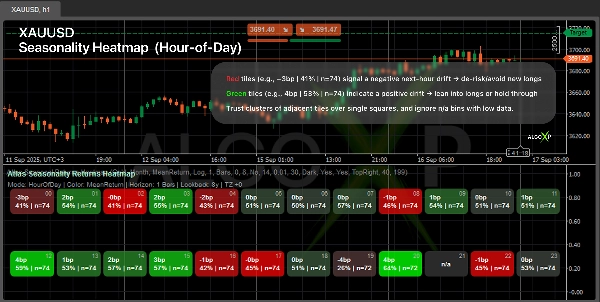
Atlasは 将来のリターン を選択した期間で計算し、対称的なヒートマップ(下 → ゼロ → 上)を描きます。各タイルは指標(平均、T統計量、または シャープレシオ)と ヒット率% | n を示します。これを使って エントリー/エグジットのタイミング、セッションの計画、および リスクのフィルタリングを行います。
🎯 トレーダーが使う理由
- 緑のウィンドウを見つけて積極的に取り組み、赤のウィンドウでは控えめに行動します。
- 統計的に有利な時間帯や曜日に合わせてセッションを計画します。
- 裁量取引やシステム取引にクリーンな「いつ」レイヤーを追加します。
⚙️ 仕組み
- 選択した期間の先を見て、その期間に価格がどのように動くかを要約します。
- 結果を時間のバケット(月/曜日/時間)にグループ化し、タイムゾーンを尊重します。
- 各バケットに対して外れ値保護と堅牢な強度スコア(およびサンプルサイズ)を適用します。
- あなたの上昇/ゼロ/下降の色を使って中立を中心にバランスの取れたヒートマップを描きます。
👥 対象者
- 裁量トレーダー — セッションごとのより良いタイミングとサイズ調整。
- システム&ボット開発者 — 戦略のための時間フィルター/時間サイズ調整レイヤー。
- 暗号通貨&指数トレーダー — 日や時間を跨いだ迅速な行動パターン。
- 初心者 — シンプルな読み方:緑が濃いほど選択した期間でよりポジティブなバイアス。
🚀 クイックスタート
- アセットプリセットを選択(Forex/Crypto/Index/Gold)。
- 期間を設定(例:HODなら1時間、DOW/Monthなら1日)。
- ルックバック、最小観測数、および色を調整します。
- 最も強いサインのためにクラスター(隣接する緑/赤のタイル複数)を読み取ります。
ℹ️ 季節性は将来の結果を保証するものではありません。 それは期間と方法論に依存する統計的パターンです。指標は エントリー/エグジットルールとリスク管理の文脈として使用し、複数のルックバック期間での堅牢性をテストし、サンプル数が少ないビンには依存しないようにしてください。
概要
AIによる概要
Atlas Seasonal Returns Heatmap is an indicator designed to reveal when markets tend to move by analyzing forward returns over user-defined horizons. It displays a symmetric heatmap organized by time buckets—Month, Day-of-Week, and Hour-of-Day—using color-coded tiles that represent metrics such as Mean, T-stat, Sharpe ratio, along with hit percentage and sample size. This visualization helps traders identify statistically favorable periods to time entries and exits, plan trading sessions, and manage risk.
The indicator supports multiple asset presets including Forex, Crypto, Indices, and Commodities, and respects the user’s timezone. It applies outlier protection and calculates a robust strength score per time bucket to ensure reliable insights. Users can customize parameters like lookback period, minimum observations, and color schemes.
Atlas is suitable for discretionary traders seeking better timing and sizing, system and bot builders needing a time-based filter or sizing layer, crypto and index traders analyzing behavioral patterns, and beginners looking for a straightforward indication of positive or negative market bias. It provides a statistical context for entry/exit decisions and risk management but should be used alongside other analysis tools.
インジケーターのプロフィール
カスタマーレビュー
4.5
レビュー: 2
5 | 50 % | |
4 | 50 % | |
3 | 0 % | |
2 | 0 % | |
1 | 0 % |
カスタマーレビュー
October 1, 2025
One green trade proves nothing. It keeps weak ideas from looking too clean.
September 21, 2025
Two sessions say more than one clean chart. The checklist feels less annoying.
ディスカッション
よくあるご質問
BTCUSD
Forex
Indices
EURUSD
Commodities
GBPUSD
NZDUSD
Prop
Crypto
Stocks
XAUUSD
NAS100
USDJPY
cTrader Storeで入手可能な取引ボット、インジケーター、プラグインなどの商品は、第三者の開発者が提供するものであり、情報と技術の取得のみを目的としてご利用いただけます。cTrader Storeはブローカーではなく、投資助言や個人的な推奨を行うことも、将来のパフォーマンスを保証することもありません。
この作成者の他の商品


価格
登録日 13/08/2025
437
販売
4.57K
無料インストール