
説明
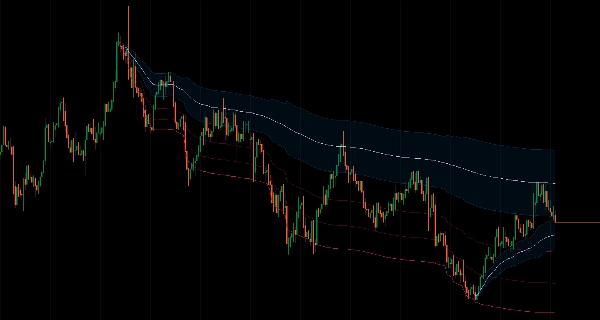
任意の市場の瞬間に移動平均の計算を固定し、価格の動きを前方に拡張しながら追跡します。
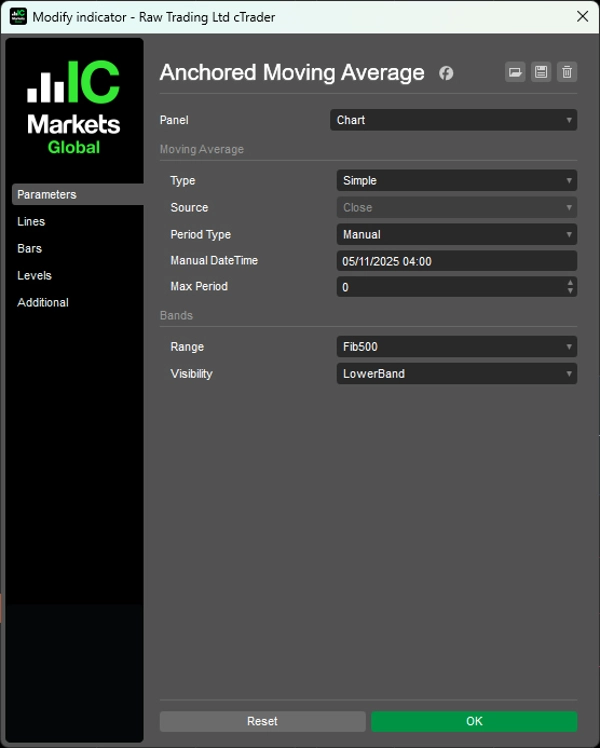
選択した開始点(手動日時または1時間から10年までのルックバック期間)に計算を固定し、実際の価格範囲に基づく適応型フィボナッチバンドで自然に成長します。
実際の価格変動に適応する8つのフィボナッチレベル(11.4%から100%)、組み込みの38.2%-62.8%の平均回帰ゾーン、二重のMAタイプ(SMA/EMA)、複数の表示モード(全バンド、極端な境界のみ、回帰ゾーンのみ)、および長期間用の最大期間制限により、重要なスイングポイントからのプルバックやイベント後の価格動向分析を目指すトレーダーに対してイベントベースのモメンタム追跡を提供します。
特徴
時間に固定された計算
- 固定期間を使用する標準的なMAとは異なり、選択した開始点から自然に成長します
- 柔軟な固定:手動日時を設定するか、事前定義されたルックバック期間(1時間から10年)を使用できます
- 重要な市場の瞬間からモメンタムを追跡します
- 異なる時間枠間で一貫した固定ポイント
適応型フィボナッチバンド
- 任意のATR倍数ではなく、実際の価格範囲に基づいて自動計算されるバンド
- 実際の価格変動に適応する8つのフィボナッチレベル(11.4%から100%)
- 平均回帰ゾーン:高確率のエントリーエリアのための組み込み38.2%-62.8%回帰ゾーン
- 数学的に定義された確率ゾーン
2種類のMAタイプ
- 単純移動平均
- 指数移動平均
- 最大期間制限:長期間での過度な平滑化を防止
複数の表示モード
- 全バンド:すべてのフィボナッチレベルを表示
- 上下のみ:極端な境界を表示
- 回帰ゾーンのみ:平均回帰エリアに集中
- 混乱のない、目的にかなったクリーンなデザイン
イベントベースの分析
- 現在の価格が重要なレベルからの動きとどのように関連しているかを確認
- イベント後の価格動向を追跡
- 明確な参照点を持つ構造ベースのエントリー
__________________________________________________________________________________________
その他の無料インジケーター
構造やボリュームから回帰、ボラティリティ、カスタム時間枠まで、幅広い市場分析ツールを探索してください。
ソースコードはGitHub リポジトリで利用可能です。
すべて無料で使用できますが、コーヒーサポートを送りたい場合は こちらからどうぞ。
サポート/レジスタンス
ボリューム
移動平均
- SSLチャネル
- 固定移動平均
- 偏差スケール移動平均
- ギャンハイローアクティベーター
- 瞬時トレンドライン
- トレンドビジョン付きカウフマン適応MA
- 移動平均チャネル
- 移動平均スイート
- トレンドチャネル移動平均
ユーティリティ/カスタム
回帰ベース
ボラティリティ
オシレーター
__________________________________________________________________________________________
免責事項
取引にはリスクが伴います。このインジケーターは技術分析専用であり、常に適切なリスク管理を行い、責任を持って取引してください。
フィードバックと改善
ご提案、機能リクエスト、改善のアイデアがあれば、ディスカッションタブにコメントを残してください。皆様のフィードバックはインジケーターの改善に役立ちます。
概要
The indicator features adaptive Fibonacci bands calculated based on the actual price range, not arbitrary multiples. It includes eight Fibonacci levels from 11.4% to 100%, with a built-in mean reversion zone between 38.2% and 62.8%, providing mathematically defined probability zones for potential entry areas. Multiple display modes are available, including full bands, extreme boundaries only, or reversion zone only, designed for a clean and purposeful chart presentation.
This tool facilitates analysis of price behavior relative to significant swing points or events, supporting structured entries and post-event price tracking. It is intended for technical analysis and includes a disclaimer advising responsible trading with proper risk management.
カスタマーレビュー
5 | 100 % | |
4 | 0 % | |
3 | 0 % | |
2 | 0 % | |
1 | 0 % |


![「[Hamster-Coder] Bollinger Bands」ロゴ](https://cdn.ctrader.com/image/webp/21d8e5d6-fb11-4bac-b9ee-cd05c2b76804_30327)


