
説明
ボリュームプロファイル更新版
前のバージョンと比較して、この更新版には重要なバグ修正、新機能、および大幅なパフォーマンス向上が含まれています:
修正点
- ボリューム分布の修正:100%をすべての接触レベルに割り当てるのではなく、ローソク足の重なりに基づく比例配分
- VAH/VAL検出の修正:固定値ではなくレベルの高さに応じた許容範囲のスケーリング
- テキスト位置の修正:固定日数ではなく動的な時間枠ベースのオフセット
- 日時検証の修正:空のバーのチェック、範囲外の検証
機能
- 日時プロファイル用のタイムゾーンオフセットパラメータを追加
- ルックバックモード用のテキスト位置パラメータ(左/右)を追加
- 日時モードのラベルがバーの端(可変幅)に従うか、プロファイルの端(全幅)に揃うように変更
パフォーマンス
- 日時インデックス検索に二分探索を導入(以前はO(n)の線形探索)
- 総ボリューム計算のキャッシュ化(以前はレベルごとに再計算)
- リサイズを避けるための事前サイズ設定されたTPO辞書
- 辞書検索にTryGetValueパターンを使用
- ホットパスでforeachの代わりにインデックスベースのループを使用
クリーンアップ
- ProfileWidthパラメータを削除(自動計算が常に正しいため)
- ローソク足の交差判定を単一条件に簡素化
__________________________________________________________________________________________
重要な注意事項 - 最初にお読みください
FXのボリュームは実際のボリュームではありません
FXのボリュームはティックボリュームです — 価格が変化した回数をカウントします。取引された金額はカウントしません。
ティックボリュームが示せないこと
- 取引サイズ。100ドルの取引も1,000万ドルの取引も1ティックとしてカウントされます。
- 実際の資金の流れ。大口資金か小口資金かはわかりません。
- 真の流動性。市場にどれだけの注文が待っているかは見えません。
- 銀行の活動。銀行は実際のボリュームデータを見ていますが、あなたは見られません。
これが意味すること
ティックボリュームは価格がどれだけ頻繁に変わったかだけを示し、その背後にある資金は示しません。これには問題があります:
- 銀行や機関を追跡できません。彼らはあなたがアクセスできない実際のボリュームデータを使用しています。
- 「スマートマネー」理論を証明できません。これらの理論には実際のボリュームが必要で、ティック数ではありません。
- 真の流動性を判断できません。ティック活動は注文の深さや市場の実力を示しません。
- 実際の買いまたは売りの力を測定できません。多くの小さな取引は一つの大きな機関取引と同じように見えます。
- ボリュームの急増は誤解を招くことがあります。急増は単なるアルゴリズムのノイズかもしれず、実際の取引興味ではありません。
このインジケーターの正しい使い方
- 資金計測器ではなく活動計測器として扱ってください。高いティックボリューム=市場が活発。低いティックボリューム=市場が静か。それ以上の意味はありません。
- 異なる時間帯の活動を比較してください。ロンドンセッションはニューヨークより忙しいか?今日は昨日より活発か?トレンド期間はレンジより活発か?を確認するために使います。
- 価格構造と組み合わせて使います。サポート/レジスタンス、スイングポイント、BOS/ChoCHとボリュームを一緒に使うことで、ノイズの多いボリューム急増からの誤信号を防ぎます。
- 重要な価格レベルでの活動を観察してください。価格が重要なレベルをテストし、ティックボリュームが増加した場合、より多くのトレーダーが活動していることを意味します。大口プレイヤーが関与しているわけではありません。
- 機関の活動を示していると仮定しないでください。ティックボリュームは蓄積、大口注文、または「スマートマネー」を示せません。リズムとテンポを測るためだけに使用してください。
__________________________________________________________________________________________
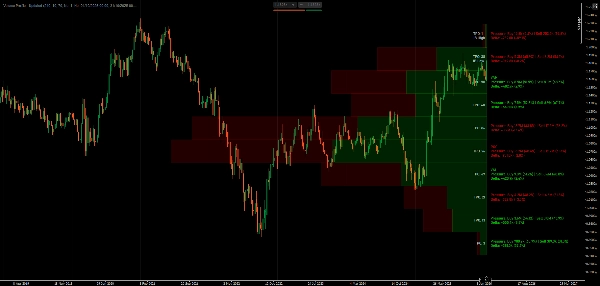
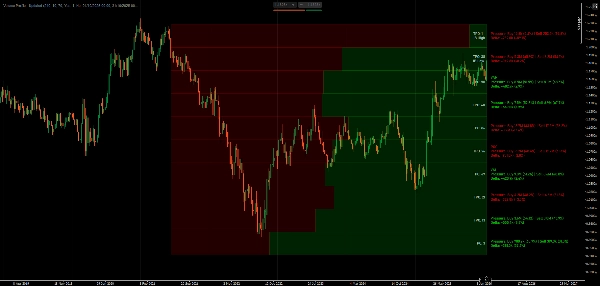
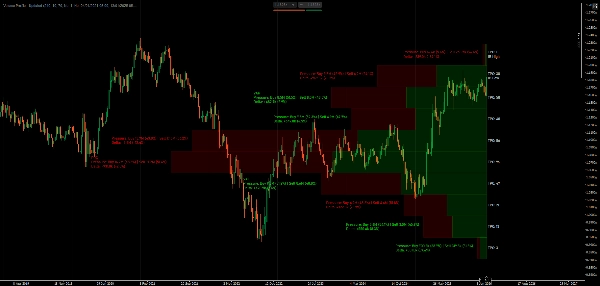
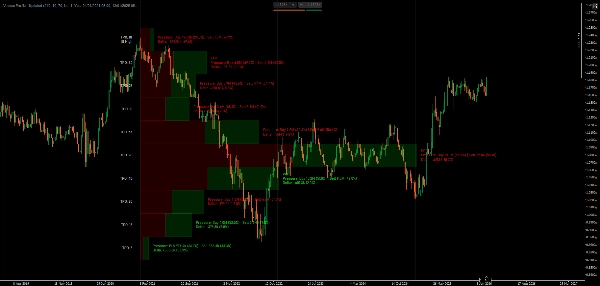
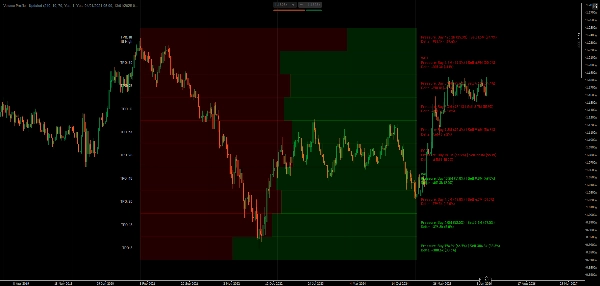
POC、バリューエリア、市場プロファイルTPOトラッキングでボリューム分布と価格滞在時間を視覚化します。
このインジケーターは市場プロファイルの概念を用いてボリューム分布を表示します。コントロールポイント(最もティック活動の多いレベル)、バリューエリアの境界(最も取引が行われた場所)、TPO文字列(各価格での滞在時間)、およびローソク足の方向によってティック活動を分割したデルタの視覚化を表示します。
ルックバック期間を選択したり、特定の日付範囲を設定したり、ボリュームバーを比例幅または全幅で表示したり、すべてのレベルまたは主要レベルのみを切り替えたり、強気/弱気の活動の色をカスタマイズしたりできます。
機能
ボリューム分布分析
- コントロールポイント(POC):最も活動が多い価格レベル—価格が最も長く滞在した場所
- バリューエリア(VA):カスタマイズ可能な活動集中ゾーン(デフォルト70%)—最も取引が行われた場所
- VAH/VAL:バリューエリアの高値/安値境界—潜在的なサポート/レジスタンスレベル
- デルタ視覚化:各価格レベルでのローソク足方向を分割表示
市場プロファイルTPO
- タイムプライスオポチュニティトラッキング:各価格で取引された時間帯の数をカウント
- TPO文字:価格での滞在時間の視覚的表現(A-Zのシーケンス)
- 初期バランス(IB):最初の1時間のレンジ—デイトレード構造に重要
- IB高値/安値マーカー:オープニングレンジの極値
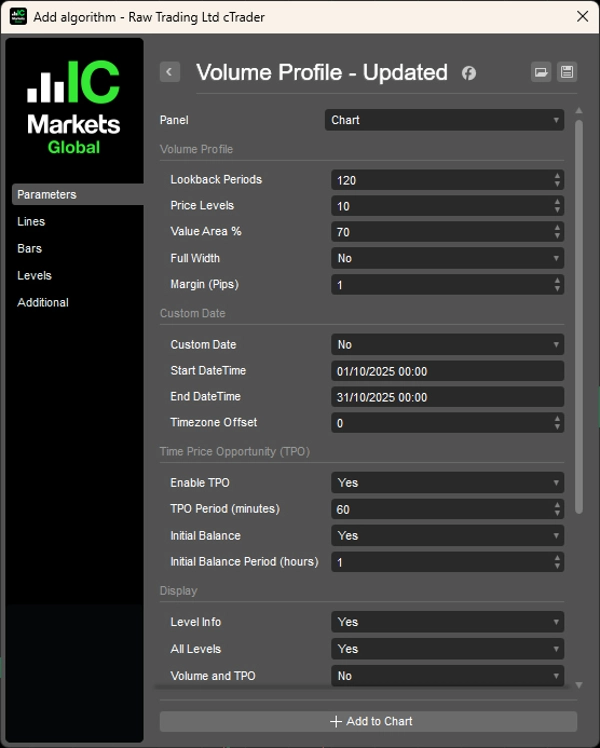
柔軟なルックバックオプション
- 期間ベース:分析するバー数を設定(例:直近120バー)
- 日時範囲:特定の日付/時間間でプロファイルを固定しイベント分析に使用
- 動的幅:自動スケールまたは固定幅のプロファイル
表示オプション
- ボリュームバー:比例幅(活動に応じたスケール)または全幅の均一バー
- 各バー内でのローソク足方向の分割表示
- パーセンテージ付きデルタ計算
- すべてのレベルまたは主要レベルのみ(POC、VAH、VAL)の切り替え
- ボリューム/TPOの詳細表示制御
- パーセンテージ付き方向別内訳
- 調整可能なフォントサイズとピップベースのマージン
色のカスタマイズ
- 強気/弱気方向バーの独立した色設定
- 正のデルタ/負のデルタのテキスト色を分ける
- TPO専用のテキスト色
パフォーマンス最適化
- キャッシュされた時間検索と効率的な矩形描画
- スムーズなパフォーマンスのための最小限の再計算
- ローソク足構造に基づくプロフェッショナルグレードのデルタ計算
__________________________________________________________________________________________
その他の無料インジケーター
構造やボリュームから回帰、ボラティリティ、カスタム時間枠まで、幅広い市場分析ツールを探索してください。
ソースコードはGitHub リポジトリで利用可能です。
すべて無料で使用できます。ただし、コーヒーサポートを送りたい場合は こちらからどうぞ。
サポート/レジスタンス
ボリューム
移動平均
- SSLチャネル
- アンカード移動平均
- 偏差スケール移動平均
- ギャンハイローアクティベーター
- 瞬時トレンドライン
- トレンドビジョン付きカウフマン適応MA
- 移動平均チャネル
- 移動平均スイート
- トレンドチャネル移動平均
ユーティリティ/カスタム
回帰ベース
ボラティリティ
オシレーター
__________________________________________________________________________________________
免責事項
取引にはリスクが伴います。このインジケーターはテクニカル分析専用です — 常に適切なリスク管理を行い、責任を持って取引してください。
フィードバックと改善
ご提案、機能リクエスト、改善案がある場合は、ディスカッションタブにコメントを残してください。皆様のフィードバックがインジケーターの改善に役立ちます。
概要
Key features include customizable lookback periods based on bar count or specific date/time ranges, dynamic or fixed profile widths, and display options for proportional or full-width volume bars. Users can toggle visibility of all levels or key levels (POC, VAH, VAL) and adjust colors independently for bullish/bearish bars and delta text. The indicator tracks Initial Balance (IB) ranges and marks IB High/Low for day trading structure.
Performance optimizations include binary search for DateTime lookups, cached volume calculations, and efficient data structures to minimize recalculations. The indicator uses tick volume, which counts price changes rather than actual traded volume, making it suitable as a market activity meter rather than a measure of real money flow or liquidity.
Supported markets include Forex, Indices, Commodities, Crypto, and Stocks. The indicator is intended for technical analysis and includes parameters for timezone offset and text positioning.
カスタマーレビュー
5 | 100 % | |
4 | 0 % | |
3 | 0 % | |
2 | 0 % | |
1 | 0 % |


