
説明
概要
基盤:Wyckoffの原則
このインジケーターはWyckoffの手法からの2つの補完的な概念に基づいて構築されています:
1. 努力と結果の比較
Wyckoffの核心原則は、価格の動き(結果)はそれを支える出来高(努力)に比例すべきだというものです。努力と結果が調和しているとき、市場は正常に動いています。これらが乖離すると、潜在的な転換点や継続の強さを示します。
このインジケーターは、効率性(努力単位あたりの結果)とその逆である吸収(結果に結びつかない努力)という指標を通じてこれを直接実装しています。
2. スプレッド分析
Wyckoffはまた、個々の価格バーの性質を分析することを強調しました。スプレッド(レンジ)、そのレンジ内での価格の終値、バーが示すコミットメントや迷いを調べます。
このインジケーターは、確信度(方向性のコミットメント)、無駄率(バー内の戻り)、および終値位置(吸収を蓄積または分配として文脈化するために使用)を通じてスプレッド分析を実装しています。
このインジケーターの機能
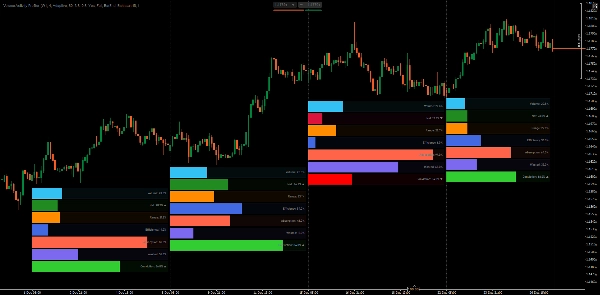
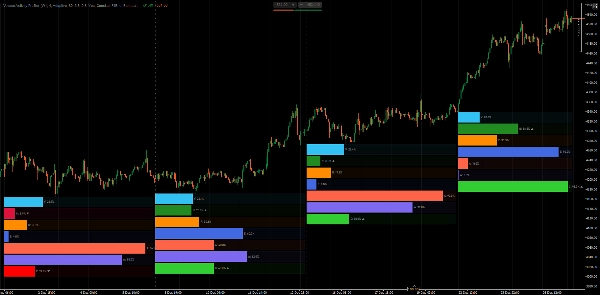
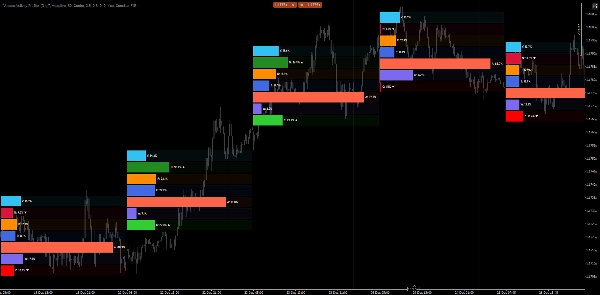
Volume Activity Profilerは選択した時間枠の価格バーを分析し、その活動を測定可能な要素に分解します。生の指標と派生したパーセンタイルベースの指標の両方を計算し、それらを分析された各バーの下に水平バーグラフとして表示します。
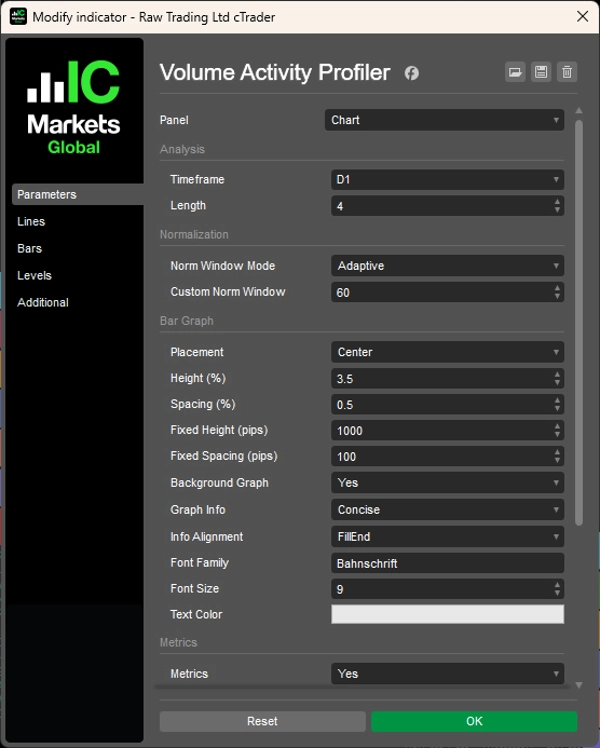
主に2つのパラメーターを設定します:
- 時間枠:分析する時間枠(例:週次、日次、H4)
- 長さ:プロファイルするバーの数(例:直近4本のバー)
その範囲内の各バーをプロファイルし、指標を計算し、互いにおよび過去の基準と比較してランク付けします。
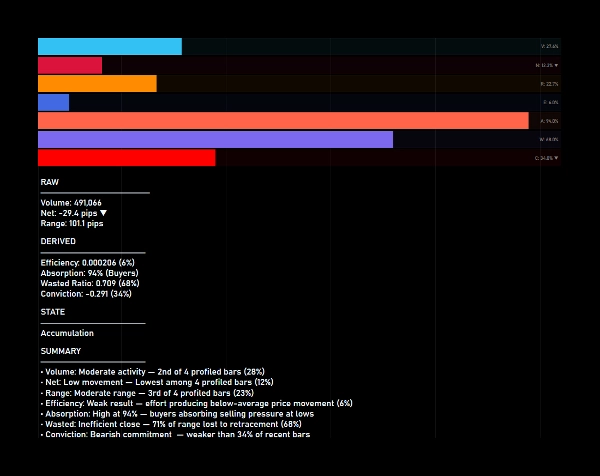
指標の説明
生の指標(プロファイルされたバー間の比率ベース):
1. ボリューム
バーのティックボリューム。プロファイルされた総ボリュームに対するこのバーの割合を示します。
2. ネット
方向性の動き(終値 − 始値)をピップスで示します。総ネット動きに対する割合を示します。色は方向を示し(緑=強気、赤=弱気)。
3. レンジ
価格の総レンジ(高値 − 安値)をピップスで示します。プロファイルされたバー間の総レンジに対する割合を示します。
派生指標(過去のウィンドウに対するパーセンタイルベース):
1. 効率性(努力対結果)
ボリューム単位あたりに生み出されたレンジ。効率性が高いほど、努力が価格の動きに変換されていることを意味します。効率性が低い場合は吸収や抵抗を示唆します。
2. 吸収(努力対結果)
効率性の逆数。吸収が高い場合、出来高が比例した価格の動きなしに吸収されていることを示し、潜在的な蓄積または分配を意味します。
3. 無駄(スプレッド分析)
戻りによって失われたレンジの割合(レンジ − ネット)/レンジ。無駄が多いほど、バーはその動きの多くを戻したことを意味します。無駄が少ない場合は、明確で方向性のあるバーを示します。
4. 確信度(スプレッド分析)
ネット/レンジとして測定される方向性のコミットメント。確信度が高い場合、バーは極端値近くで終値をつけています。確信度が低い場合は迷いや拒絶を示します。
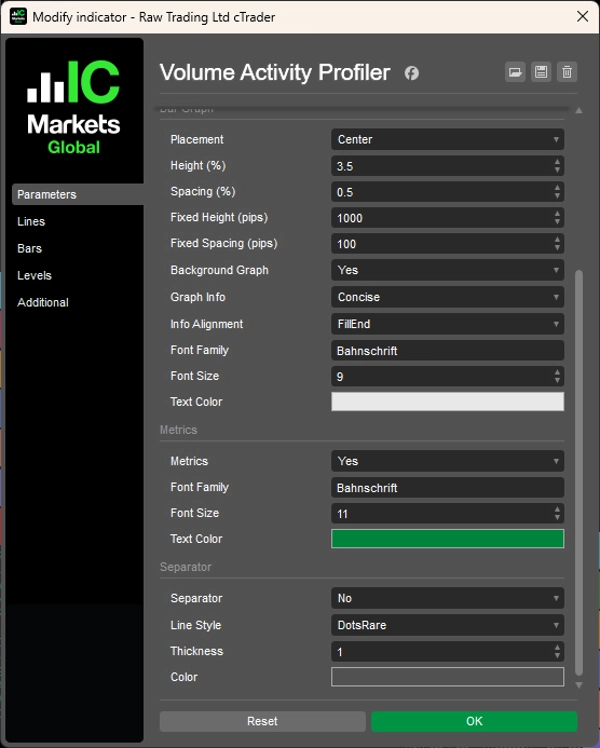
バーグラフの理解
各プロファイルされたバーは7つの水平バーを表示します:
- ボリューム、ネット、レンジ — プロファイルされたバー間の比率に基づいて塗りつぶされます
- 効率性、吸収、無駄、確信度 — 過去データに対するパーセンタイルランクに基づいて塗りつぶされます
効率性が80%まで塗りつぶされたバーは、このバーの効率性が正規化ウィンドウ内の80%のバーより高いことを意味します。
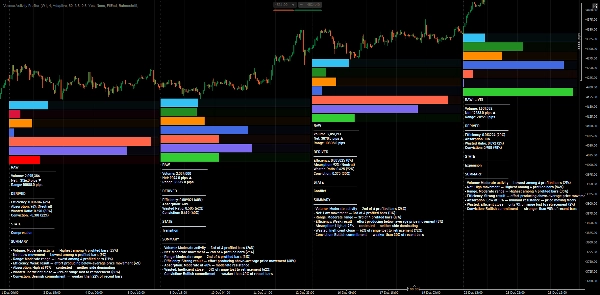
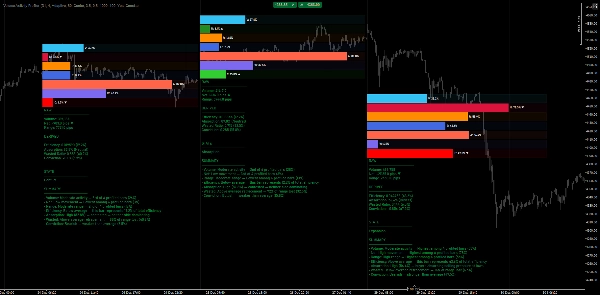
活動状態の分類
指標表示が有効な場合、インジケーターは各バーを以下の状態のいずれかに分類します:
1. 圧縮
低効率+低確信度 — 価格が巻きつき、潜在的なエネルギーが蓄積されている状態
2. 拡張
高効率+高確信度+低無駄 — 強い方向性の動き
3. 対立
高無駄+低確信度 — 買い手と売り手の戦い
4. 蓄積
高吸収+安値近くでの終値 — 買い手が売り圧力を吸収している状態
5. 分配
高吸収+高値近くでの終値 — 売り手が買い圧力を吸収している状態
6. 拒絶
高確信度だが方向と反対の終値 — 失敗した動き、潜在的な反転
7. 遷移
混合シグナル — 状態間の市場の遷移
実用的な利点
- 迅速な努力対結果の評価 — 出来高が比例した動きを生み出しているか、吸収されているかを即座に確認できます。
- マルチタイムフレーム構造分析 — 実行時間枠に留まりながら上位時間枠のバーを分析できます。
- 蓄積/分配の識別 — 高い吸収と終値位置により、大口プレイヤーの活動場所を明らかにします。
- 疲弊と拒絶の発見 — 高い確信度と反対の終値位置が潜在的な反転を警告します。
- バーの客観的比較 — ランキングとパーセンタイルにより、「高い」または「低い」出来高の評価から主観性を排除します。
- ブレイクアウトの確認 — 高効率と確信度を伴う拡張状態が本物のブレイクアウトの関心を確認します。
ティックボリュームを努力の代理として使用
このインジケーターは努力の入力としてティックボリュームを使用します。FXでは、ティックボリュームは実際の取引量ではなく価格変動の頻度を表しており、分散型市場の既知の制限です。
それにもかかわらず、ティックボリュームは以下の理由で努力の代理として効果的に機能します:
- バー間の相対的な市場活動を反映している
- 高いティック数は参加者の関与の増加を示す
- 努力と結果の関係は成り立つ—高い活動で動きが少ない場合でも吸収を示す
データが一貫している限り、インジケーターのパーセンタイルランキングとバーの比較は有効です。
注意事項
- インジケーターはAdaptiveモードに設定されている場合、時間枠に基づく適応正規化ウィンドウを使用し、関連する過去の文脈を確保します。
- パーセンタイル計算は形成中のバーの不安定な読み取りを避けるため、完了したバーのみで更新されます。
- 現在形成中のバーはメトリクスパネルで[LIVE]とマークされています。
__________________________________________________________________________________________
その他の無料インジケーター
構造やボリュームから回帰、ボラティリティ、カスタム時間枠まで幅広い市場分析ツールを探求してください。
ソースコードはGitHubの リポジトリで入手可能です。
すべて無料で使用できますが、コーヒーサポートを送りたい場合は こちらからどうぞ。
サポート/レジスタンス
ボリューム
- Volume Activity Profiler
- Volume Efficiency Analyzer
- Volume Profile Analytics
- Volume Profile - Updated
- Volume Spread Analysis
- VWAP(出来高加重平均価格)
移動平均
- SSLチャネル
- アンカード移動平均
- 偏差スケール移動平均
- ギャンハイローアクティベーター
- 瞬時トレンドライン
- トレンドビジョン付きカウフマン適応MA
- 移動平均チャネル
- 移動平均スイート
- トレンドチャネル移動平均
ユーティリティ/カスタム
回帰ベース
ボラティリティ
オシレーター
__________________________________________________________________________________________
免責事項
取引にはリスクが伴います。このインジケーターはあくまでテクニカル分析用であり、常に適切なリスク管理を行い、責任を持って取引してください。
フィードバックと改善
ご提案、機能リクエスト、改善案があれば、ディスカッションタブにコメントを残してください。皆様のフィードバックがインジケーターの改善に役立ちます。
概要
The indicator profiles price bars over a user-selected timeframe and length, calculating raw metrics such as Volume (tick volume proportion), Net (directional price movement), and Range (price range). It also derives percentile-based metrics including Efficiency (price movement per volume unit), Absorption (volume without proportional price change), Wasted Ratio (retracement within the bar), and Conviction (directional commitment).
These metrics are visually represented as horizontal bar graphs beneath each analyzed bar, facilitating objective comparison and historical context. The indicator classifies bars into activity states like Compression, Expansion, Conflict, Accumulation, Distribution, Rejection, and Transition, aiding in identifying market phases and potential turning points.
Volume Activity Profiler uses tick volume as an effort proxy, reflecting relative market activity. It supports multi-timeframe analysis and updates percentile rankings on completed bars to ensure stable readings. This tool assists traders in assessing volume efficiency, spotting accumulation/distribution, confirming breakouts, and understanding market structure through quantitative volume and price bar analysis.
カスタマーレビュー
5 | 100 % | |
4 | 0 % | |
3 | 0 % | |
2 | 0 % | |
1 | 0 % |


