present
ลงทะเบียนและรับส่วนลด $50 สำหรับการซื้อครั้งแรกของคุณ
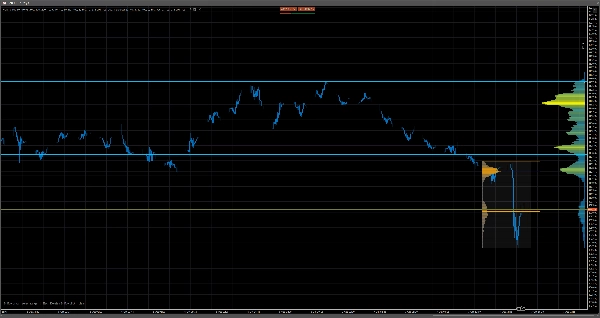
Trading product for Volume Profile Pro v1.0 อินดิเคเตอร์ Premium/Discount  Key Levels, image 1
Volume Profile Pro v1.0
อินดิเคเตอร์
5 การซื้อ
เวอร์ชัน 2.0, Oct 2026
Windows, Mac
4.3
รีวิว: 3
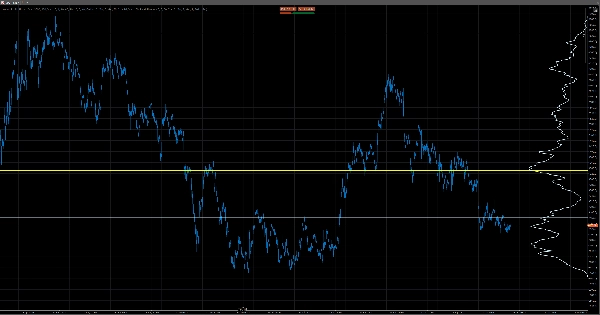
Trading product for Volume Profile Pro v1.0 อินดิเคเตอร์ Premium/Discount  Key Levels, image 2
Trading product for Volume Profile Pro v1.0 อินดิเคเตอร์ Premium/Discount  Key Levels, image 3
Trading product for Volume Profile Pro v1.0 อินดิเคเตอร์ Premium/Discount  Key Levels, image 4
Trading product for Volume Profile Pro v1.0 อินดิเคเตอร์ Premium/Discount  Key Levels, image 5
Trading product for Volume Profile Pro v1.0 อินดิเคเตอร์ Premium/Discount  Key Levels, image 6
Trading product for Volume Profile Pro v1.0 อินดิเคเตอร์ Premium/Discount  Key Levels, image 7
Trading product for Volume Profile Pro v1.0 อินดิเคเตอร์ Premium/Discount  Key Levels, image 8
Trading product for Volume Profile Pro v1.0 อินดิเคเตอร์ Premium/Discount  Key Levels, image 9
Trading product for Volume Profile Pro v1.0 อินดิเคเตอร์ Premium/Discount  Key Levels, image 10
Trading product for Volume Profile Pro v1.0 อินดิเคเตอร์ Premium/Discount  Key Levels, image 11
ตั้งแต่ 18/01/2026
19
การขาย

คำอธิบาย

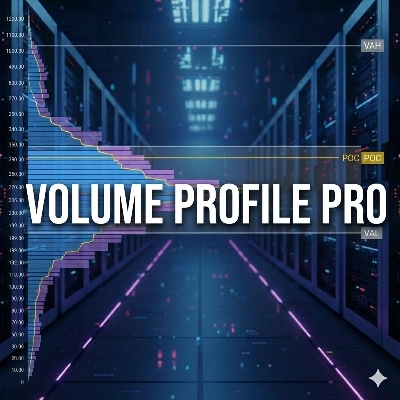
Volume Profile Pro v2 ใหม่เป็นตัวบ่งชี้ Volume Profile แบบด้านข้าง & ช่วงที่ปรับแต่งได้สูงและน้ำหนักเบาสำหรับ cTrader ซึ่งคุณสามารถปรับการตั้งค่ามากมายตามความชอบของคุณได้ รวมถึง Point Of Control (POC), Value Area High (VAH) และ Value Area Low (VAL)


สิ่งที่มันทำ

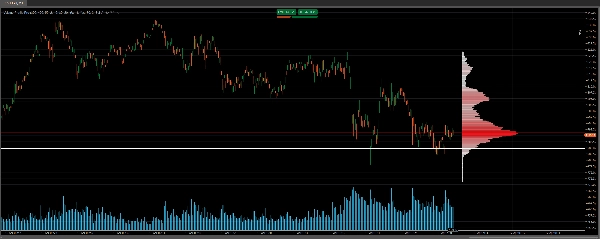
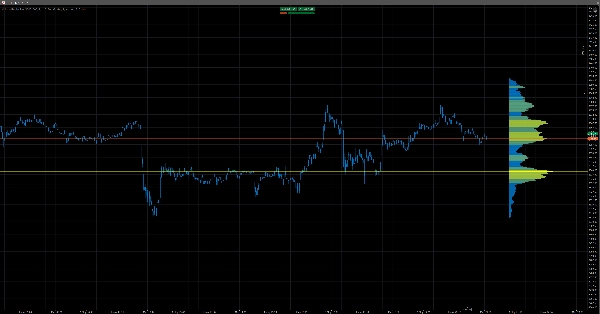
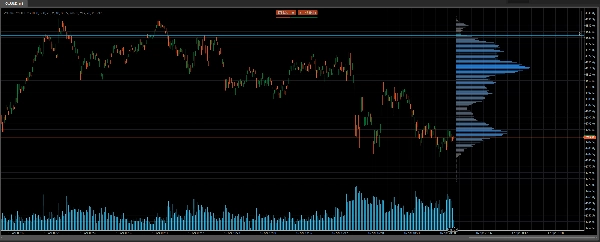
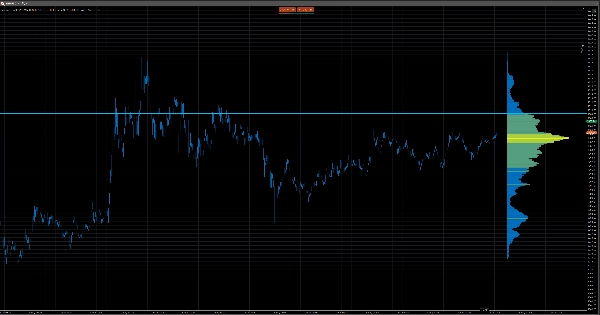
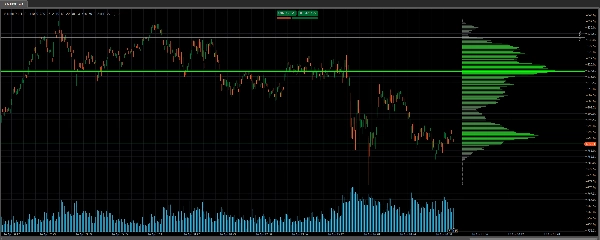
Volume Profile Pro วาดฮิสโตแกรมแนวนอนแบบไดนามิกโดยตรงที่ด้านขวาของกราฟ cTrader ของคุณ แสดงปริมาณการซื้อขายที่เกิดขึ้นในแต่ละระดับราคาในช่วงเวลาที่กำหนด แทนที่จะวัดปริมาณตามเวลา มันวัดปริมาณ ตามราคา — เผยให้เห็นทันทีว่าตลาดได้ทำธุรกรรมมากที่สุดที่ใด จากนี้ มันจะคำนวณและวาดระดับสำคัญสามระดับโดยอัตโนมัติ: Point of Control (POC) ราคาที่มีปริมาณการซื้อขายสูงสุด; และ Value Area High (VAH) และ Value Area Low (VAL) ขอบเขตของช่วงราคาที่มีปริมาณการซื้อขายทั้งหมด 70% (สามารถตั้งค่าได้)


วิธีการทำงาน

ตัวบ่งชี้จะสแกนจำนวนแท่งเทียนย้อนหลังที่ผู้ใช้กำหนด หาช่วงราคาสูงสุดถึงต่ำสุด และแบ่งเป็นแถวราคาที่เว้นระยะเท่าๆ กัน ปริมาณ tick ของแต่ละแท่งจะถูกแจกจ่ายไปยังแถวราคาทุกแถวที่ครอบคลุม ผลลัพธ์คือฮิสโตแกรมปริมาณตามราคาโดยมีความกว้างแท่งที่ปรับแต่งได้ตามสัดส่วนของปริมาณและโทนสีไล่ระดับจากแถวที่มีปริมาณต่ำไปสูง มันทำงานโดยใช้ข้อมูล OHLCV ระดับแท่งเทียนมาตรฐานทั้งหมด — ไม่ต้องใช้ฟีด tick, DOM หรือแหล่งข้อมูลภายนอก — และคำนวณใหม่เฉพาะที่แท่งเทียนล่าสุด ทำให้รวดเร็ว น้ำหนักเบา และไม่รบกวน


ปรับแต่งได้สูง

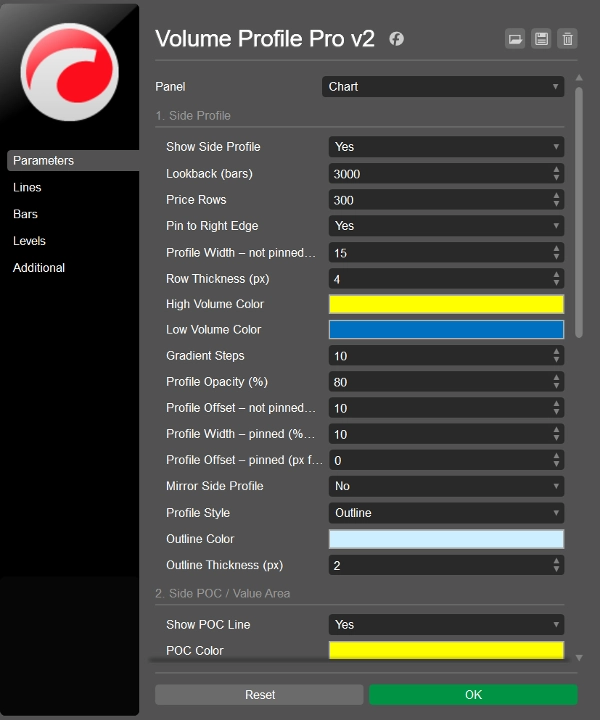
ด้วย Volume Profile Pro v2 แทบทุกองค์ประกอบทั้งภาพและวิเคราะห์สามารถปรับแต่งได้:

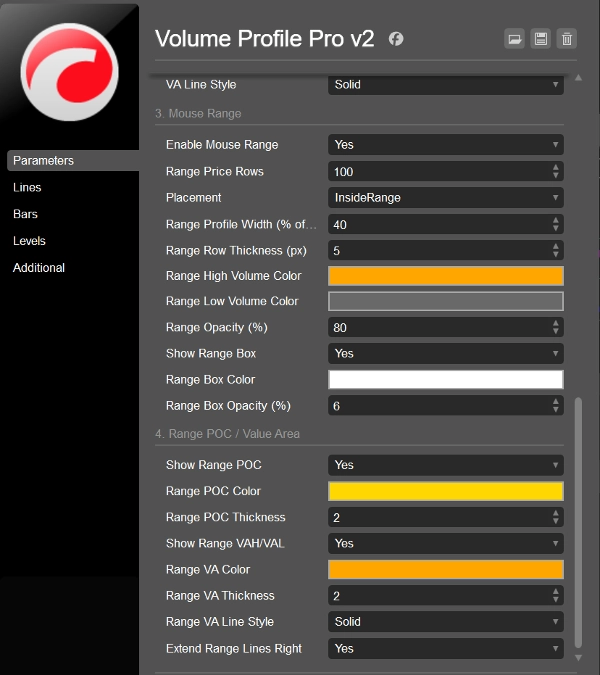
  • ช่วงเวลาย้อนหลังของโปรไฟล์ด้านข้าง
  • จำนวนแถวราคา & ความหนาของแถว
  • ความกว้างของโปรไฟล์
  • ความทึบแสง
  • โทนสีไล่ระดับ
  • คุณสามารถพลิกโปรไฟล์ด้านข้างได้
  • คุณสามารถตรึงโปรไฟล์ด้านข้างไว้ที่ด้านขวาของกราฟได้
  • คุณมีตัวเลือกในการแสดงโปรไฟล์ด้านข้างเป็นเส้นเดียวแทนแท่ง
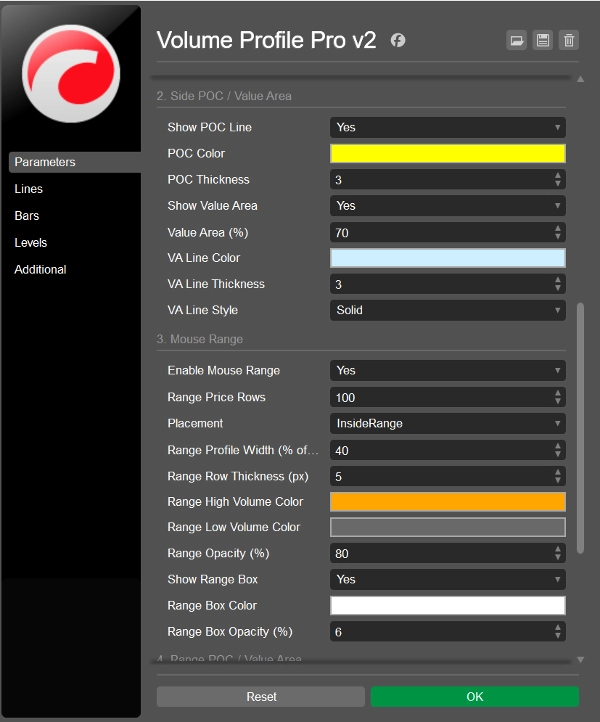
  • สีและความหนาของ POC
  • เกณฑ์เปอร์เซ็นต์ของ Value Area
  • สไตล์เส้นของ Value Area
  • นอกจากนี้คุณยังสามารถแสดงโปรไฟล์ช่วงในช่วงที่เลือกได้ เพียงเลือกเครื่องหมายเล็ง ลากเครื่องหมายเล็ง + กด shift เพื่อเลือกช่วง และกดปุ่ม Esc สองครั้งเพื่อเอาโปรไฟล์ช่วงออก

สิ่งนี้ทำให้มันใช้งานได้ทั้งเป็นชั้นอ้างอิงพื้นหลังที่ละเอียดอ่อนหรือเป็นเครื่องมือวิเคราะห์เดี่ยวที่โดดเด่น


เหมาะสำหรับใคร

  • เทรดเดอร์ที่ต้องการตัวบ่งชี้ Volume Profile แบบด้านข้าง & ช่วงที่น้ำหนักเบา
  • เทรดเดอร์ที่ต้องการ Volume Profile ที่ดูสะอาดตา ซึ่งคุณยังสามารถแสดงโปรไฟล์ปริมาณเป็นเส้นทึบได้
  • เทรดเดอร์ที่ต้องการตั้งค่าช่วงเวลาย้อนหลังบนกราฟด้วยตนเอง
  • เทรดเดอร์ที่ต้องการความสามารถในการตั้งค่าสีและความทึบแสงหลายค่า
  • เทรดเดอร์ที่ต้องการปรับความกว้างและตำแหน่งบนกราฟ หรืออยากตรึงไว้ที่ด้านข้าง
  • เทรดเดอร์ที่ต้องการตั้งจำนวนแถวราคา (แนะนำให้ต่ำกว่า 400)
  • เทรดเดอร์ที่ต้องการเปิดหรือปิดเส้น Point Of Control (POC), Value Area High (VAH) และ Value Area Low (VAL) และปรับลักษณะการแสดงผล


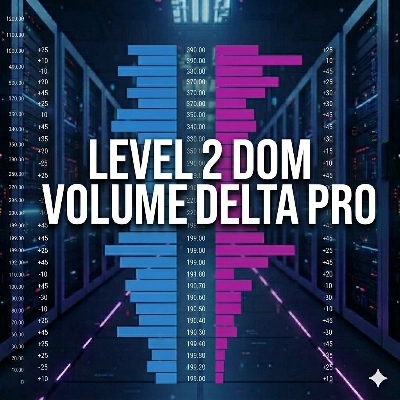
รวมสิ่งนี้กับตัวบ่งชี้ Level 2 DOM Volume Delta Pro ของเราเพื่อการตัดสินใจที่มีข้อมูลมากขึ้นในระดับสำคัญ: https://ctrader.com/products/4138


ดู Black Box Bot ที่น่าทึ่งของเราที่นี่: https://ctrader.com/products/3241


สรุป

AI summary
Volume Profile Pro is a customizable volume profile indicator designed for cTrader. It displays a horizontal histogram on the chart representing traded volume by price level over a user-defined lookback period. The indicator identifies and plots three key levels: Point of Control (POC)—the price with the highest traded volume, Value Area High (VAH), and Value Area Low (VAL), which define the price range containing a configurable percentage (default 70%) of total volume.

The tool analyzes historical bar data by dividing the high-to-low price range into evenly spaced rows and distributing each bar’s tick volume across these rows. This creates a volume-at-price histogram with adjustable bar widths proportional to volume and a gradient color scheme indicating volume intensity. It operates solely on standard OHLCV bar data without requiring tick feeds or external sources, recalculating only on the latest bar to maintain performance.

Users can extensively customize visual and analytical settings, including lookback period, number of price rows, profile width, opacity, colors, and the appearance and visibility of POC, VAH, and VAL lines. This flexibility allows the indicator to serve as either a subtle background reference or a prominent analytical tool. It supports analysis of key market structure concepts such as supply and demand, support and resistance, and liquidity zones.
โปรไฟล์อินดิเคเตอร์
หมวดหมู่อินดิเคเตอร์
ปริมาณ
ประเภทเอาต์พุต
การแสดงเป็นภาพ
ข้อกำหนดด้านข้อมูล
ปริมาณ
ข้อมูล Tick
DoM
แท่งเท่านั้น
สัญญาณที่รองรับ
Breakout
Reversal
เบรก Level ที่ระบุ
แตะ Level ที่ระบุ
ความผันผวน

รีวิวจากลูกค้า

4.3
รีวิว: 3
5
33 %
4
67 %
3
0 %
2
0 %
1
0 %
รีวิวจากลูกค้า
May 1, 2026
Fine for a side read, especially when the chart is not clean.
April 27, 2026
it works as a side layer because it supports the plan without acting like the plan, and 2 sessions is the line to watch.
April 22, 2026
not bad if the rules are already clear. 30 days gives the idea room.

การสนทนา

คำถามที่พบบ่อย

Premium/Discount
Key Levels
Volume
Market Structure
Supply & Demand
Liquidity Grab
Support & Resistance
ผลิตภัณฑ์ที่มีให้บริการผ่าน cTrader Store รวมถึงบอทการเทรด อินดิเคเตอร์ และปลั๊กอิน มีให้บริการโดยนักพัฒนาบุคคลที่สามและมีไว้เพื่อวัตถุประสงค์ในการเข้าถึงข้อมูลและทางเทคนิคเท่านั้น cTrader Store ไม่ใช่โบรกเกอร์และไม่ได้ให้คำแนะนำการลงทุน คำแนะนำส่วนบุคคล หรือการรับประกันผลการดำเนินงานในอนาคต

เพิ่มเติมจากผู้เขียนคนนี้

อินดิเคเตอร์
BOS
Volume
+5
The Volume Delta Indicator using Institutional Level 2 DOM Data, The Edge Institutions Pay Millions For, now on cTrader
"Black Box Bot" โลโก้
ยอดนิยม
4.0
(4)
จาก $39
cBot
Volume
XAUUSD
+5
The Black Box Bot v2 is out. A New Revolution. Make up to 750% per year on Gold m5.
อินดิเคเตอร์
VWAP
Volume
+5
Multi VWAP. Three timeframes. One clean chart. Your Essential Trading Tool.

นอกจากนี้คุณยังอาจชอบ

อินดิเคเตอร์
BB Breakout Oscillator with alerts! Spot trend reversals using Bollinger Bands. Bullish/Bearish crossovers Alerts.
อินดิเคเตอร์
BOS
CHOCH
+5
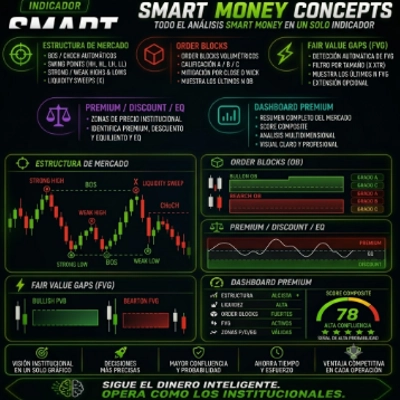
Smart Money Concepts Automate your institutional analysis and make decisions with pinpoint precision..
อินดิเคเตอร์
RSI
RSI on the main chart with 45/55 momentum levels, overbought/oversold levels, averaged RSI, and multi-timeframe support.
อินดิเคเตอร์
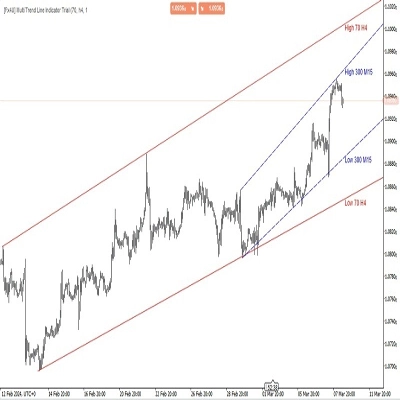
Allow trader to draw multi trendlines in different timeframes on one chart,Give trader an overview of the current market
อินดิเคเตอร์
Volume
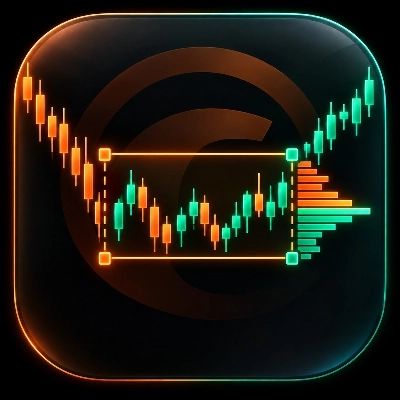
Select a price range and read POC, VAH and VAL from tick activity on your cTrader chart.
"Smart Bar Predictor" โลโก้
ยอดนิยม
4.2
(4)
$25
/
$40
อินดิเคเตอร์
AI
ATR
+27
🔮 Smart Bar Predictor - Professional Volatility Forecasting Indicator
"Zig-Zag Extremity Tracker" โลโก้
เรตติ้งสูง
4.6
(5)
$19
/
$30
อินดิเคเตอร์
RSI
Breakout
+1
Dynamically adjusts regression channels based on ZigZag extremes, resetting when price breaks bands to track real trends
อินดิเคเตอร์
BOS
Add standard-timeframe context candles to a native Renko chart.
อินดิเคเตอร์
ATR
SMC
+21
MA Quant Adaptive Price Zone Oscillator identifie dynamiquement les zones de prix optimales pour les entrées et sorties.
อินดิเคเตอร์
EMA
AI-assisted
+1
Multi EMA Timeframes lets you stay on your chart and see the exact EMA from any timeframe you choose — up to 5 at once.
"Liquidity Edge" โลโก้
ยอดนิยม
4.4
(5)
$19
/
$29
อินดิเคเตอร์
Imbalance
Inside Bar
+3
A clean and powerful Smart Money Concepts tool combining Fair Value Gaps, Previous Daily High/Low, Inside/Outside bar
อินดิเคเตอร์
SMC
Prop
+12
Multi-TF FVG + Smart Fibonacci
อินดิเคเตอร์
RSI
Forex
+4
😎Read the description before purchasing💩
อินดิเคเตอร์
SMC
Forex
+5
Detects Break of Structure (BOS) and Change of Character (CHOCH)
"Market Regime_Detector" โลโก้
เรตติ้งสูง
4.6
(5)
$23
อินดิเคเตอร์
ADX
ATR
+5
Identifies TRENDING, RANGING and VOLATILE markets with pullback detection. Anti-noise filter. Works on ANY chart.
อินดิเคเตอร์
BOS
CHOCH
+5
A professional-grade cTrader indicator for traders following the Inner Circle Trader (ICT) methodology.
อินดิเคเตอร์
VWAP
Volume
+5
Multi VWAP. Three timeframes. One clean chart. Your Essential Trading Tool.
"Stochastic Momentum Index" โลโก้
เรตติ้งสูง
4.2
(4)
$19
/
$20
อินดิเคเตอร์
Prop
Forex
+14
Stochastic Momentum Index (SMI) for cTrader optional higher-timeframe source, and clear overbought/oversold levels.

ราคา

ตั้งแต่ 18/01/2026
19
การขาย