Descripción
Sistema de canal adaptativo de tres colores que utiliza promedios móviles en los cuatro precios OHLC para el análisis de dirección y estructura de la tendencia.
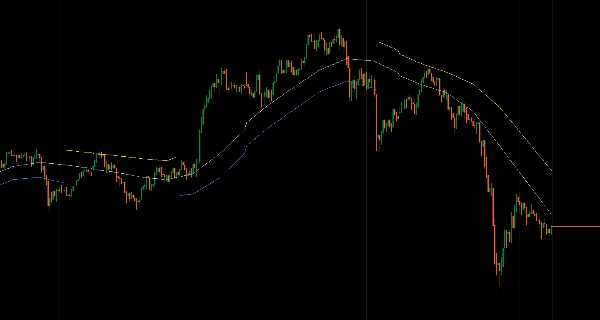
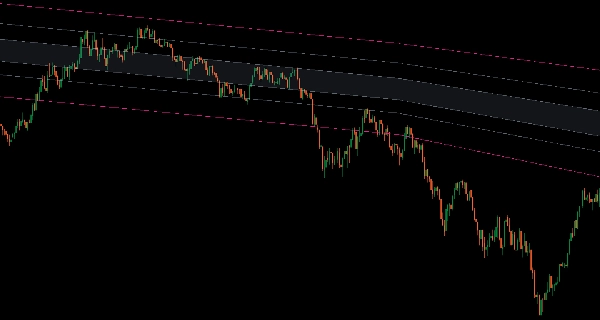
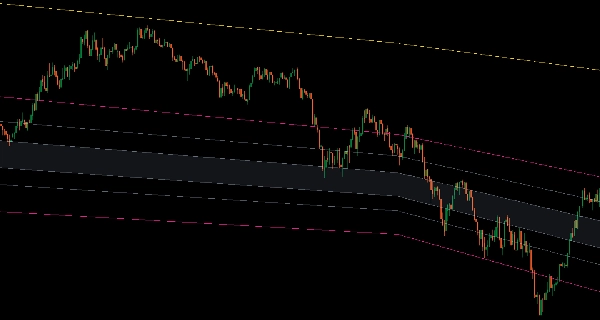
Muestra los límites Alto/Bajo, líneas de sesgo direccional de Apertura/Cierre y el equilibrio Medio con estados de tendencia codificados por colores (Azul tendencia alcista, Dorado tendencia bajista, Gris neutral) que se adaptan juntos.
Dos modos de visualización (canal completo o reducción de desorden basada en la tendencia), seis zonas opcionales de Fibonacci (retrocesos de canal completo, niveles de medio canal, extensiones de ruptura), 15 algoritmos de promedio móvil (Arnaud Legoux, Jurik, Hull, KAMA, VIDYA, Escalado por desviación, SuperSmoother, Ultimate Smoother, McGinley Dynamic, T3, ZLEMA, Laguerre), interpolación multitemporal, cálculo de fecha ancla para períodos crecientes basados en eventos y coloreado de barras basado en la tendencia que ofrecen una estructura cohesiva del canal para traders que buscan retrocesos y reversión a la media dentro de límites definidos.
CARACTERÍSTICAS
Sistema de Tendencia de Tres Colores
- Líneas azules: Tendencia alcista confirmada—operar retrocesos hacia la línea baja
- Líneas doradas: Tendencia bajista confirmada—operar rebotes hacia la línea alta
- Líneas grises: Neutral/rango—evitar extremos, operar en el medio
- Todas las líneas se adaptan juntas—sin señales mixtas
Estructura Completa del Canal
- Las líneas Alto/Bajo definen los límites del canal
- Las líneas Apertura/Cierre muestran el sesgo direccional dentro del canal
- La línea media (centro de los cuatro) marca el equilibrio verdadero
- Estructura integrada que se mueve de forma cohesiva
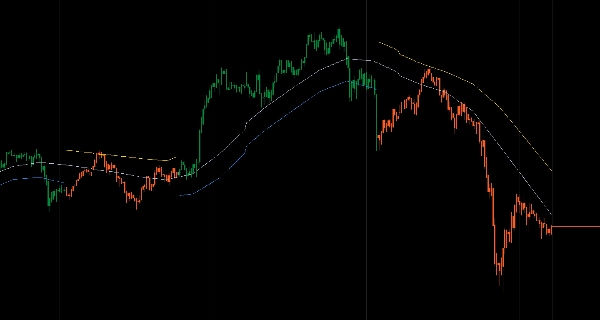
Dos Modos de Visualización
- Modo Canal: Siempre mostrar ambos límites con colores de tendencia
- Modo Basado en Tendencia: Ocultar línea alta en tendencias alcistas, línea baja en tendencias bajistas—reduce el desorden visual, mantiene el enfoque en el límite operable
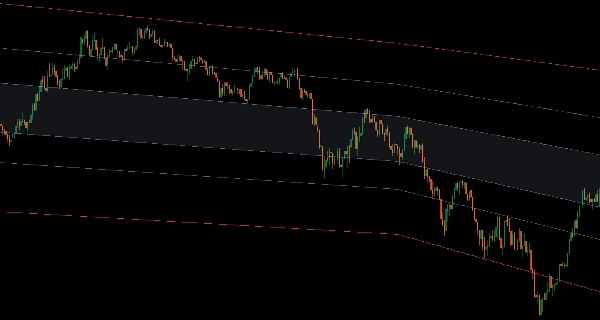
6 Zonas de Fibonacci (Opcional)
- Entre Bajo-Alto (retrocesos de canal completo)
- Entre Bajo-Medio o Medio-Alto (niveles de medio canal)
- Extensiones superior/inferior (objetivos de ruptura)
- Rango total (de la extensión inferior a la superior)
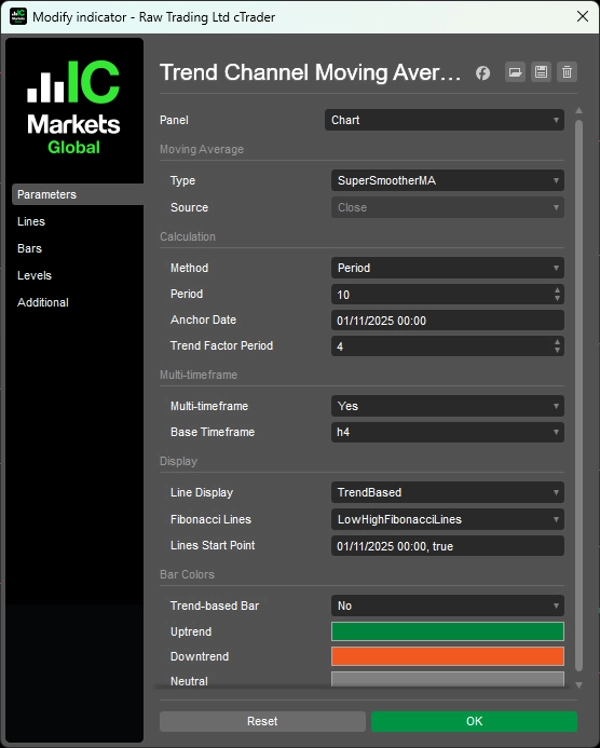
15 Tipos de Promedios Móviles
- Algoritmos profesionales: Arnaud Legoux, Jurik, Hull, KAMA, VIDYA, Escalado por desviación, SuperSmoother, Ultimate Smoother, McGinley Dynamic, T3, ZLEMA, Laguerre
- Señales limpias optimizadas para la identificación de tendencias
Funcionalidad Avanzada
- Modo multitemporal con interpolación suave
- Cálculo de fecha ancla (período creciente desde evento/nivel específico)
- Coloreado de barras basado en tendencia (opcional)
- Control del punto de inicio de las líneas (ocultar datos históricos, mostrar solo estructura reciente)
__________________________________________________________________________________________
MÁS INDICADORES GRATUITOS
Explora una amplia gama de herramientas de análisis de mercado—desde estructura y volumen hasta regresión, volatilidad y marcos temporales personalizados.
El código fuente está disponible en el repositorio de GitHub repository.
Todos son gratuitos para usar. Pero si deseas apoyar con un café, puedes hacerlo aquí.
Soporte/Resistencia
Volumen
- Perfilador de Actividad de Volumen
- Analizador de Eficiencia de Volumen
- Análisis de Perfil de Volumen
- Perfil de Volumen - Actualizado
- Análisis de Dispersión de Volumen
- VWAP (Precio Promedio Ponderado por Volumen)
Promedios Móviles
- Canal SSL
- Promedio Móvil Anclado
- Promedio Móvil Escalado por Desviación
- Activador Gann Alto Bajo
- Línea de Tendencia Instantánea
- Promedio Móvil Adaptativo Kaufman con Visión de Tendencia
- Canal de Promedio Móvil
- Suite de Promedios Móviles
- Promedio Móvil de Canal de Tendencia
Utilidades/Personalizados
Basado en Regresión
Volatilidad
Osciladores
__________________________________________________________________________________________
DESCARGO DE RESPONSABILIDAD
El trading implica riesgos. Este indicador está destinado solo para análisis técnico — siempre aplique una gestión adecuada del riesgo y opere con responsabilidad.
COMENTARIOS Y MEJORAS
Si tienes sugerencias, solicitudes de funciones o ideas para mejoras, por favor deja un comentario en la pestaña de Discusión. Tus comentarios ayudan a mejorar el indicador para todos.
Resumen
Key features include two display modes—full channel and trend-based clutter reduction—and six optional Fibonacci zones covering full and half-channel retracements plus breakout extensions. The system supports 15 professional moving average algorithms such as Arnaud Legoux, Jurik, Hull, KAMA, VIDYA, and others, optimized for clean trend identification. Additional functionalities include multi-timeframe interpolation, anchor date calculation for event-based periods, trend-based bar coloring, and control over line start points to focus on recent data.
This indicator is designed to help traders identify pullbacks and mean reversion opportunities within defined channel boundaries, enhancing decision-making in various market conditions.
Valoraciones de clientes
5 | 100 % | |
4 | 0 % | |
3 | 0 % | |
2 | 0 % | |
1 | 0 % |