説明
カーネル加重回帰数学を用いた適応型トレンド分析。
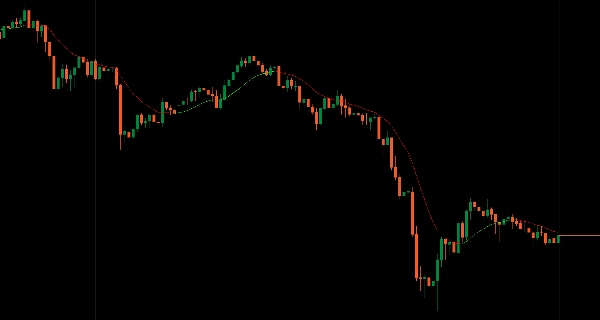
近くのバーがより影響し、遠くのバーは指数関数的に薄れるガウスカーネル加重を適用し、固定期間の遅延なしに超滑らかなトレンドラインを作成します。
局所の価格構造に自動調整し、従来の移動平均と比較して遅延が最小限、動的な色分け(ライムは上昇トレンド、赤は下降トレンド)、応答性調整のための帯域幅調整可能、柔軟な遡及ウィンドウ(50〜2000バー)、および二色のノイズフリーデザインにより、任意の期間選択なしで適応的な平滑化を求めるトレーダーに数学的に正確なトレンド識別を提供します。
特徴
カーネル加重計算
- 近くのバーがより影響し、遠くのバーは指数関数的に薄れる—任意の固定期間なし
- 数学的に最適な平滑化のためのガウスカーネル加重
- 手動の再調整なしで局所の価格構造に自動調整
- 最小限の遅延:同等の移動平均よりも実際のトレンド変化に迅速に反応
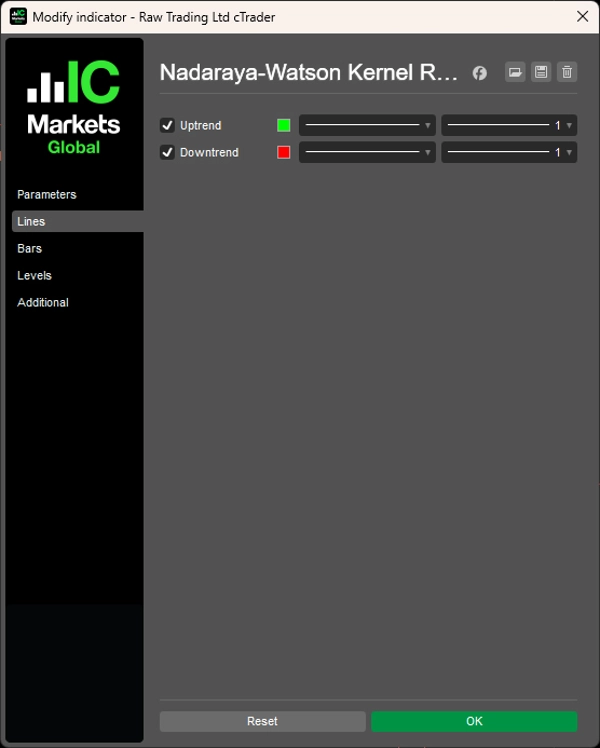
動的色分け
- ライム:上昇トレンド
- 赤:下降トレンド
- トレンド方向の即時視覚確認
- 不連続線表示:色の変化は即時かつ視覚的に明確
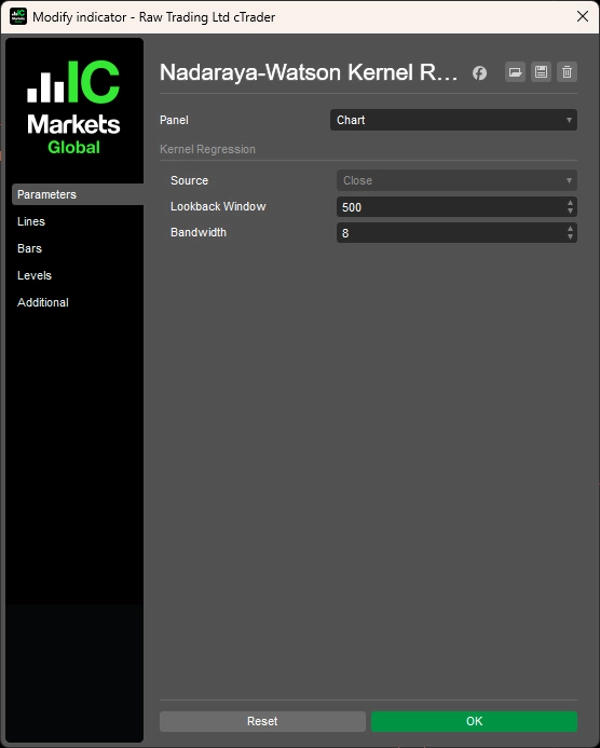
調整可能なパラメータ
- 帯域幅:応答性と滑らかさの微調整
- 柔軟な遡及ウィンドウ:タイムフレームに合わせて50〜2000バー
- 異なる市場状況や取引スタイルに適応
クリーンデザイン
- 二色、無駄のない—上昇トレンドか下降トレンドのいずれか
- ノイズのないトレンド識別
- 複雑な設定不要
- 数学的精度を伴う視覚的シンプルさ
__________________________________________________________________________________________
その他の無料インジケーター
構造やボリュームから回帰、ボラティリティ、カスタムタイムフレームまで、幅広い市場分析ツールを探索してください。
ソースコードはGitHub リポジトリで入手可能です。
すべて無料で使用できますが、コーヒーサポートを送りたい場合は こちらからどうぞ。
サポート/レジスタンス
ボリューム
移動平均
- SSLチャネル
- アンカード移動平均
- 偏差スケール移動平均
- ギャンハイローアクティベーター
- 瞬時トレンドライン
- カウフマン適応移動平均とトレンドビジョン
- 移動平均チャネル
- 移動平均スイート
- トレンドチャネル移動平均
ユーティリティ/カスタム
回帰ベース
ボラティリティ
オシレーター
__________________________________________________________________________________________
免責事項
取引にはリスクが伴います。このインジケーターは技術分析専用です—常に適切なリスク管理を行い、責任を持って取引してください。
フィードバックと改善
ご提案、機能リクエスト、改善アイデアがありましたら、ディスカッションタブにコメントを残してください。皆様のフィードバックはインジケーターの改善に役立ちます。
概要
Key features include dynamic color coding with lime indicating uptrends and red indicating downtrends, offering instant visual confirmation of trend direction through a noise-free, two-color design. Users can fine-tune the indicator’s responsiveness and smoothness via adjustable bandwidth and select a flexible lookback window ranging from 50 to 2000 bars to suit various timeframes and market conditions.
The indicator emphasizes mathematical precision and visual simplicity, requiring no complex settings. It is designed for traders seeking an adaptive smoothing method for trend identification without arbitrary period selection. This tool supports scalping strategies and is part of a broader suite of market analysis indicators focused on regression, volume, volatility, and custom timeframes.
カスタマーレビュー
5 | 100 % | |
4 | 0 % | |
3 | 0 % | |
2 | 0 % | |
1 | 0 % |