
Descripción
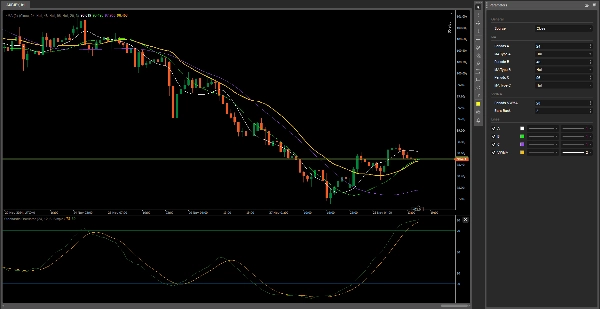
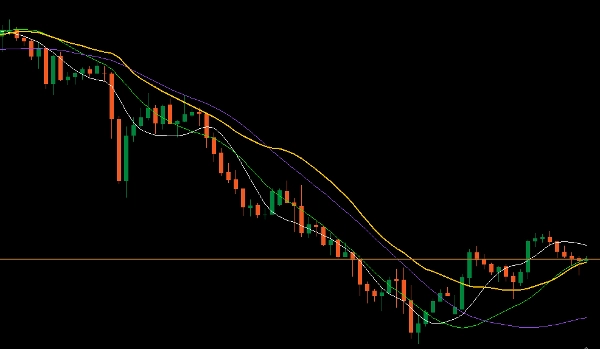
Este indicador consta de 3 medias móviles que se pueden configurar a tu gusto, desde el tipo de media móvil hasta sus colores, grosor y tipo de línea.
La cuarta es VWMA (Media Móvil Ponderada por Volumen) – la fórmula típica para este indicador es - VWMA de 3 días = (C1 * V1 + C2 * V2 + C3 * V3) / (V1 + V2 + V3).
En esta opción, he creado la posibilidad de repetir el intervalo no solo 3 veces sino hasta 500 veces.
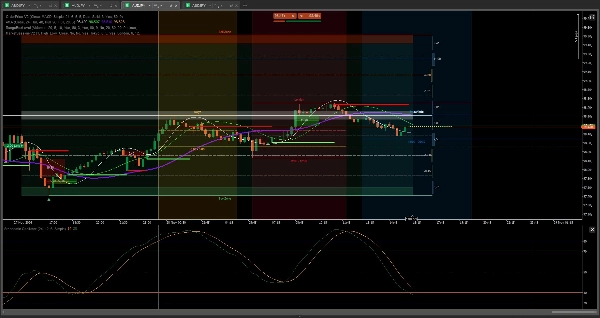
Lo creé para mantener el gráfico limpio.
Los parámetros predeterminados son la media móvil hull que es perfecta y los períodos 24, 48, 96 son más óptimos para mí en cada marco temporal.
Adicional
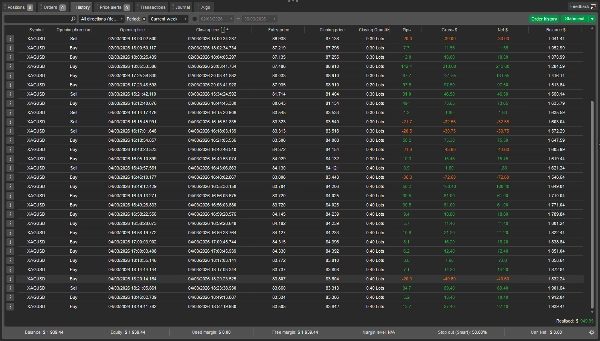
Estas son las herramientas que me ayudan a ganar dinero
https://ctrader.com/products/3441?u=Thomas-Sparrow
https://ctrader.com/products/526?u=Thomas-Sparrow
https://ctrader.com/products/3137?u=Thomas-Sparrow
https://ctrader.com/products/2913?u=Thomas-Sparrow
Serás invencible
Buena suerte 😀
Resumen
Valoraciones de clientes
5 | 100 % | |
4 | 0 % | |
3 | 0 % | |
2 | 0 % | |
1 | 0 % |


