
Mô tả
Bộ Dao động Hồi quy Tuyến tính (LRO) là một chỉ báo kỹ thuật dựa trên phân tích hồi quy tuyến tính, thường được sử dụng trong các thị trường tài chính để đánh giá động lượng và hướng đi của xu hướng giá. Nó đo khoảng cách giữa giá hiện tại và giá trị dự đoán bởi một đường hồi quy tuyến tính, về cơ bản là đường khớp tốt nhất trong một khoảng thời gian xác định. Dưới đây là phân tích về cách hoạt động và các thành phần của nó:
Các thành phần chính của Dao động Hồi quy Tuyến tính
- Đường Hồi quy Tuyến tính (Đường Khớp tốt nhất): Đường này biểu thị chuyển động giá dự kiến trong một khoảng thời gian nhất định và được tính toán bằng kỹ thuật hồi quy tuyến tính. Độ dốc của đường cho biết hướng của xu hướng: độ dốc dương gợi ý xu hướng tăng, trong khi độ dốc âm chỉ xu hướng giảm.
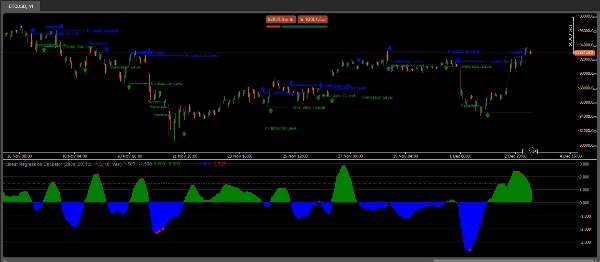
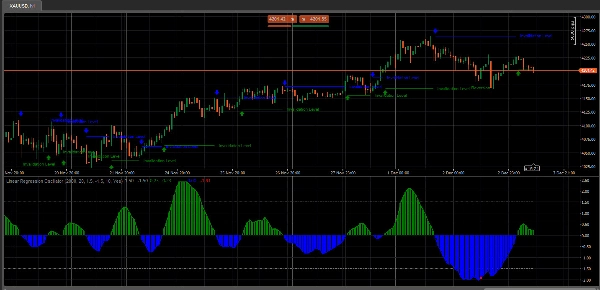
- Giá trị Dao động: Giá trị dao động được tính bằng cách đo độ lệch giữa giá hiện tại và đường hồi quy tuyến tính. Độ lệch này được biểu diễn dưới dạng giá trị dao động, thường dao động quanh đường số 0.
- Đường Số 0: Đường số 0 trong biểu đồ LRO đóng vai trò như đường cơ sở. Khi giá trị dao động vượt lên trên đường số 0, nó gợi ý động lượng tăng giá, và khi cắt xuống dưới thì gợi ý động lượng giảm giá.
- Cài đặt và Khoảng thời gian: Cài đặt khoảng thời gian xác định số thanh hoặc điểm dữ liệu được xem xét để tính toán đường hồi quy tuyến tính. Nhà giao dịch điều chỉnh cài đặt này để phù hợp với chiến lược giao dịch ngắn hạn hoặc dài hạn, tùy thuộc vào khung thời gian phân tích ưa thích.
Cách Nhà giao dịch Sử dụng Dao động Hồi quy Tuyến tính
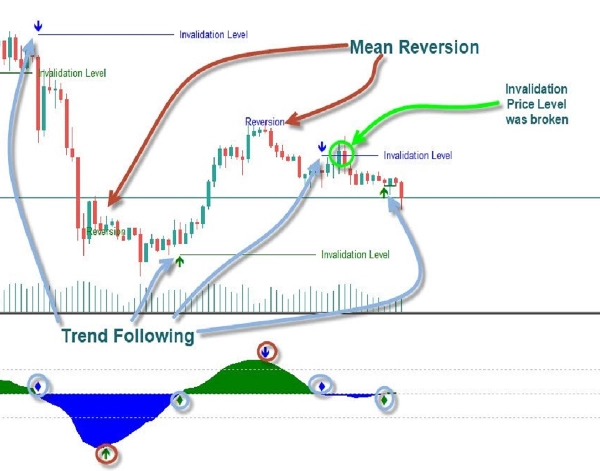
- Xác định Xu hướng: LRO giúp nhà giao dịch nhận biết liệu xu hướng giá hiện tại có động lượng hay không bằng cách hiển thị khoảng cách tương đối giữa giá và đường hồi quy dự kiến.
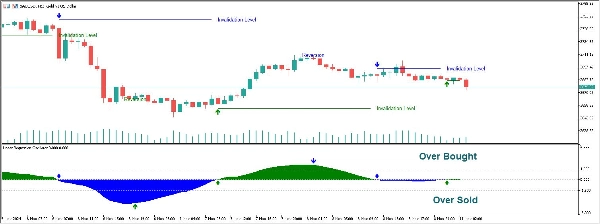
- Mức Quá Mua/Quá Bán: Giá trị cực đoan trong dao động có thể chỉ ra điều kiện quá mua hoặc quá bán, gợi ý khả năng đảo chiều hoặc cần điều chỉnh vị thế.
- Tín hiệu Phân kỳ: Khi chuyển động giá và chỉ báo LRO phân kỳ, nó có thể báo hiệu động lượng suy yếu hoặc khả năng đảo chiều.
Mẹo Diễn giải
- Cắt qua Đường Số 0: Việc cắt lên trên số 0 có thể chỉ ra xu hướng tăng mới nổi, trong khi cắt xuống dưới số 0 gợi ý xu hướng giảm.
- Điều chỉnh Khoảng thời gian: Khoảng thời gian ngắn hơn làm cho LRO nhạy hơn, bắt được các chuyển động giá nhanh nhưng tăng nhiễu. Khoảng thời gian dài hơn làm mượt dao động, phù hợp để nhận diện xu hướng dài hạn hơn.
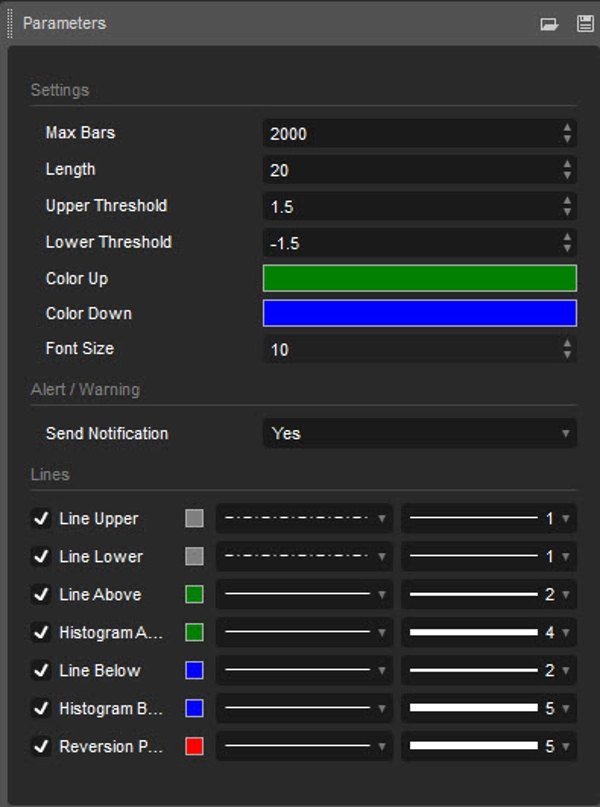
Ghi chú Sử dụng:
- Độ dài: Xác định khoảng thời gian mà hồi quy tuyến tính được tính toán
- Ngưỡng Trên/Dưới: Xác định giới hạn trên và dưới để nhận diện điều kiện quá mua và quá bán. Giá trị ngoài các ngưỡng này gợi ý khả năng đảo chiều.
Dao động Hồi quy Tuyến tính được đánh giá cao vì kết hợp phân tích thống kê với nguyên tắc theo xu hướng, làm cho nó trở thành công cụ linh hoạt cho cả nhà giao dịch động lượng và theo xu hướng. Nó đặc biệt hữu ích trong các thị trường có xu hướng, giúp nhận diện sự tiếp diễn hoặc đảo chiều xu hướng dựa trên độ lệch so với đường xu hướng hồi quy.
Tóm tắt
Đánh giá của khách hàng
5 | 0 % | |
4 | 100 % | |
3 | 0 % | |
2 | 0 % | |
1 | 0 % |


