
GUPPY-MASTER V3
インジケーター
251 ダウンロード数
バージョン 1.0、Mar 2026
Windows、Mac
5.0
レビュー: 3
説明
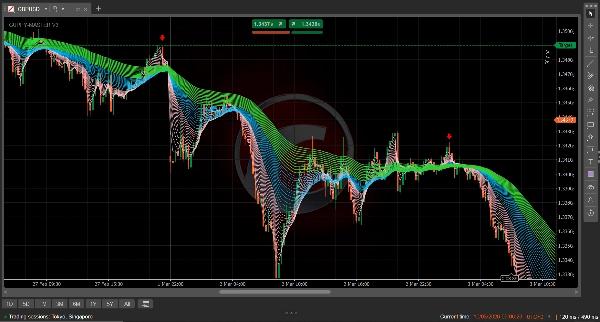
GUPPY TREND MASTER V3 (4X4 TRADING TECHNOLOGY )
38-EMAレインボーで市場のセンチメントを視覚化
この Guppy Trend Master 4X4 は、複雑な価格変動を市場心理の明確で色分けされたマップに変換するcTrader用のプレミアムテクニカル分析ツールです。38本の指数移動平均線(EMA)を同時にプロットすることで、トレーダーは一時的な「ノイズ」と本物のトレンド転換を区別できます。
4X4ビジュアルロジック
このインジケーターは、市場データを3つの異なる「リボン」に整理し、トレンドの多次元的な視点を提供します:
- ピンクリボン(期間2–15): 「スペキュレーター」グループ。これらのラインは短期トレーダーを表します。広がるとモメンタムが高く、収縮すると動きが疲弊しています。
- ブルーリボン(期間17–41): 「ブリッジ」グループ。これは重要な移行ゾーンとして機能します。強いトレンド中の再エントリーの「バウンス」エリアとしてよく使われます。
- グリーンリボン(期間44–74): 「インベスター」グループ。これは長期的なセンチメントを表します。広がったグリーンリボンは強力で安定したトレンドを示し、破られにくいです。
なぜこのインジケーターを使うのか?
- 即時トレンド確認: リボンが絡み合っている場合は様子見。広がって分離している場合はトレンドが強いことが一目でわかります。
- 精密スキャルピングゾーン: M1およびM5の時間枠に特化して最適化されており、「押し目買い」と「戻り売り」ゾーンを正確にハイライトします。
- ボラティリティの視覚化: リボン間の「ギャップ」は動きの裏にある確信度を示します。「明確なギャップ」(4X4ロジックで見られる)は高確率の取引環境を示します。
- 遅延なしのロジック: 指数移動平均(EMA)を使用することで、4X4は標準のSMAベースのGuppyインジケーターよりも価格変動に速く反応し、現代の高頻度市場に適しています。
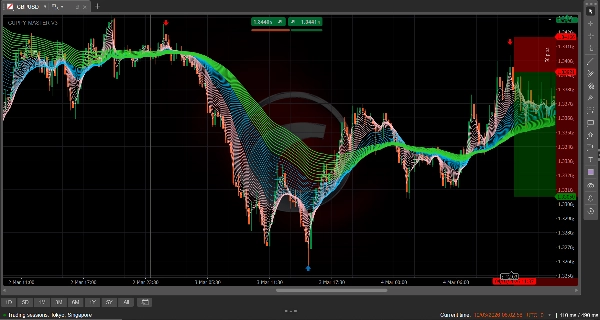
シグナルの読み方
- 強気の強さ: ピンクが上、次にブルー、グリーンが下。すべてのグループが上向きに広がり、ライン間に明確なスペースがあります。
- 弱気の強さ: グリーンが上、次にブルー、ピンクが下。すべてのグループが下向きに広がっています。
- スクイーズ: 3つのグループが一点に収束すると、大きなブレイクアウトが差し迫っています。
概要
AIによる概要
The GUPPY TREND MASTER V3 is a technical analysis indicator designed for the cTrader platform that visualizes market sentiment using 38 Exponential Moving Averages (EMAs). It organizes these EMAs into three color-coded ribbons to provide a multi-dimensional view of market trends: the Pink Ribbon (periods 2–15) reflects short-term speculator activity, the Blue Ribbon (periods 17–41) serves as a transitional bridge zone, and the Green Ribbon (periods 44–74) indicates long-term investor sentiment. This structure helps traders distinguish between market noise and genuine trend reversals.
Key features include instant trend confirmation by observing ribbon separation or entanglement, precision scalping zones optimized for 1- and 5-minute timeframes, and visualization of market volatility through the spacing between ribbons. The use of EMAs ensures faster reaction to price changes compared to traditional SMA-based Guppy indicators, supporting high-frequency trading environments.
Signal interpretation is based on ribbon positioning and spacing: bullish trends show Pink above Blue above Green with upward fanning, bearish trends show the reverse with downward fanning, and convergence of all ribbons signals an imminent breakout. The indicator supports various markets including forex pairs (GBPUSD, USDJPY), cryptocurrencies, stocks, and commodities like gold (XAUUSD).
インジケーターのプロフィール
カスタマーレビュー
5.0
レビュー: 3
5 | 100 % | |
4 | 0 % | |
3 | 0 % | |
2 | 0 % | |
1 | 0 % |
カスタマーレビュー
March 29, 2026
This is a nice indicator 😀. Overall the images are what is represented on the chart no faking. But only the arrows missing. Let me hope version 2 has them.
March 17, 2026
Very good 👍👍 indicator. Have looked for it every where finally I found it works every well
ディスカッション
よくあるご質問
Signal
Breakout
Scalping
GBPUSD
Crypto
Stocks
XAUUSD
NAS100
USDJPY
cTrader Storeで入手可能な取引ボット、インジケーター、プラグインなどの商品は、第三者の開発者が提供するものであり、情報と技術の取得のみを目的としてご利用いただけます。cTrader Storeはブローカーではなく、投資助言や個人的な推奨を行うことも、将来のパフォーマンスを保証することもありません。
この作成者の他の商品


価格
登録日 27/02/2026
33.16K
取引数量
25.96K
獲得pips
8
販売
391
無料インストール