
Side Volume Profile
Indicador
11 compras
Versión 1.0, Aug 2025
Windows, Mac
4.3
Valoraciones: 3
Desde 26/05/2025
381.37M
Volumen operado
60.65K
Pips ganados
14
Ventas
1.39K
Instalaciones gratis
Descripción
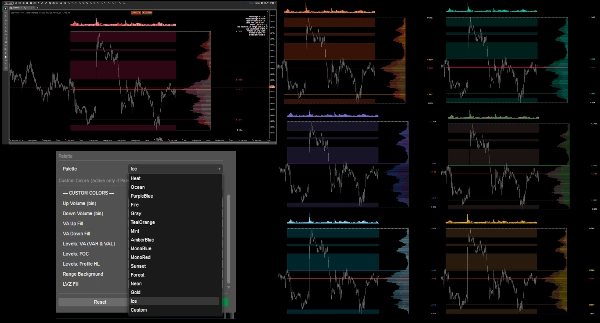
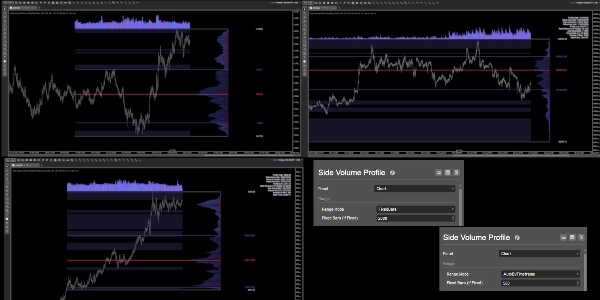
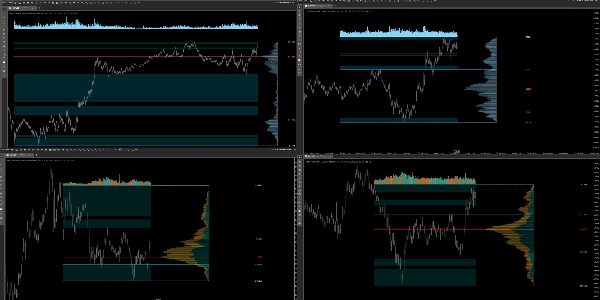
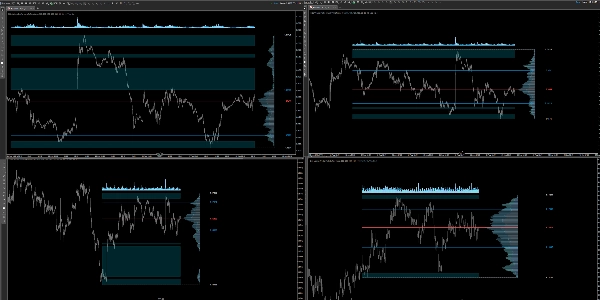
Un Perfil de Volumen en el lado derecho, que siempre está fijado a las últimas barras y no salta cuando desplazas el gráfico. Calcula el volumen por precio en un rango elegido (automático por marco temporal o un conteo fijo de barras), muestra POC, VAH/VAL, límites del perfil (Alto/Bajo), resalta zonas de bajo volumen (LVZ) y dibuja un histograma de volumen con EMA por encima del rango (desplazamiento en pips). Incluye un panel de estadísticas en la esquina superior derecha, varias paletas de alto contraste más colores personalizados, opacidad global de bins, controles de ancho/desplazamiento y grosor/estilo por línea. Diseñado para legibilidad y rendimiento.
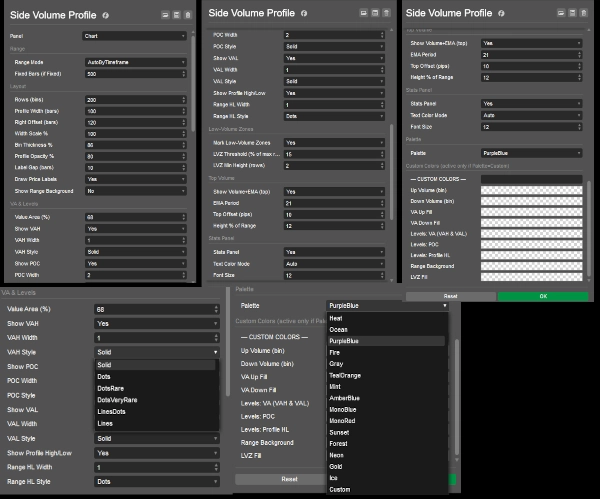
- Rango: AutoPorMarcoTemporal o BarrasFijas.
- Diseño: Filas (bins), Ancho del Perfil / Escala de Ancho, Desplazamiento Derecho, Grosor del Bin, Espacio de Etiqueta, opacidad del perfil; fondo de rango opcional.
- VA y Niveles: Porcentaje del Área de Valor, alternar VAH/POC/VAL, ancho y estilo de línea por nivel; Alto/Bajo del perfil.
- Zonas de Bajo Volumen: Umbral (% del máximo de fila) y altura mínima (filas).
- Volumen Superior: Período EMA, altura (% del rango), desplazamiento predeterminado 10 pips.
- Paleta/Personalizado: Elige un tema o establece tus propios colores (VAH = VAL).
- Panel de Estadísticas: Alternar, tamaño de fuente
Documentación del indicador
Resumen
Perfil del indicador
Valoraciones de clientes
4.3
Valoraciones: 3
5 | 33 % | |
4 | 67 % | |
3 | 0 % | |
2 | 0 % | |
1 | 0 % |
Valoraciones de clientes
Conversación
Preguntas frecuentes
BTCUSD
Forex
Indices
EURUSD
Commodities
GBPUSD
NZDUSD
Prop
Fair Value Gap
SMC
Crypto
Stocks
XAUUSD
NAS100
USDJPY
VWAP
Los productos disponibles a través de cTrader Store, incluidos bots, indicadores y plugins para operar, son proporcionados por desarrolladores de terceros y están disponibles únicamente con fines informativos y de acceso técnico. cTrader Store no es un bróker, por lo que no proporciona asesoramiento de inversión, recomendaciones personales ni ninguna garantía de rentabilidad futura.


Precio
Desde 26/05/2025
381.37M
Volumen operado
60.65K
Pips ganados
14
Ventas
1.39K
Instalaciones gratis