
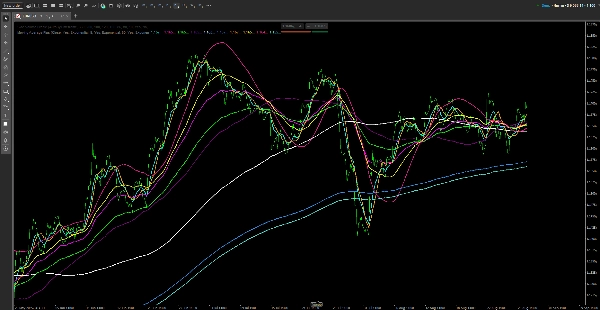
Moving Average Plus
指标
144 下载
版本 1.0, Aug 2025
Windows 版、Mac 版
说明
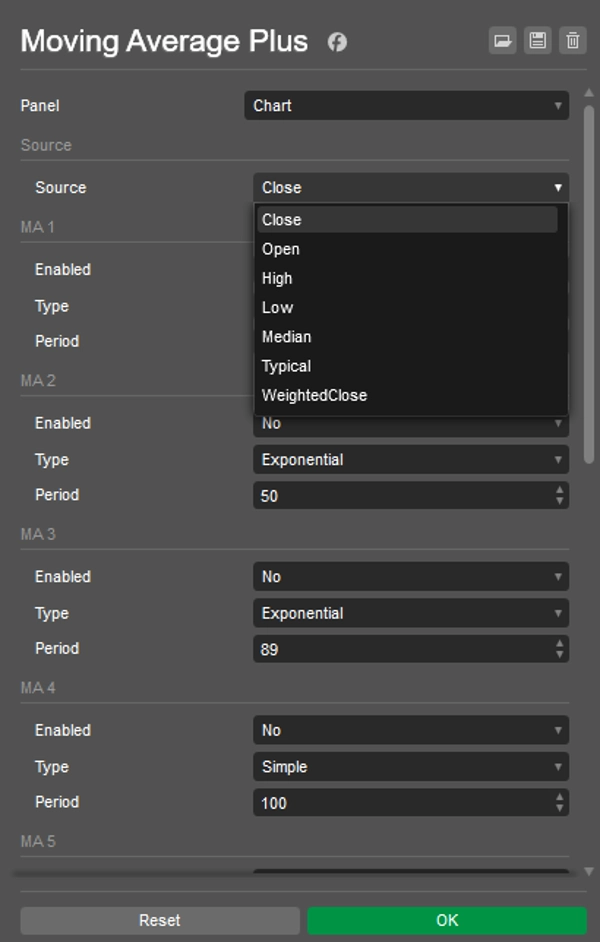
全局
- 来源 – 所有线条使用的价格输入:收盘价、开盘价、最高价、最低价、中位数、典型价或加权收盘价。
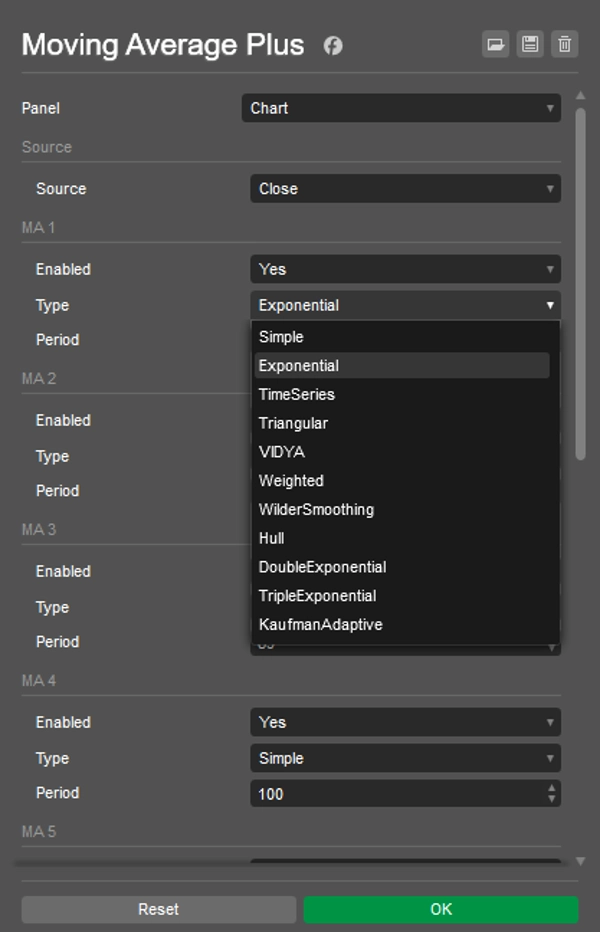
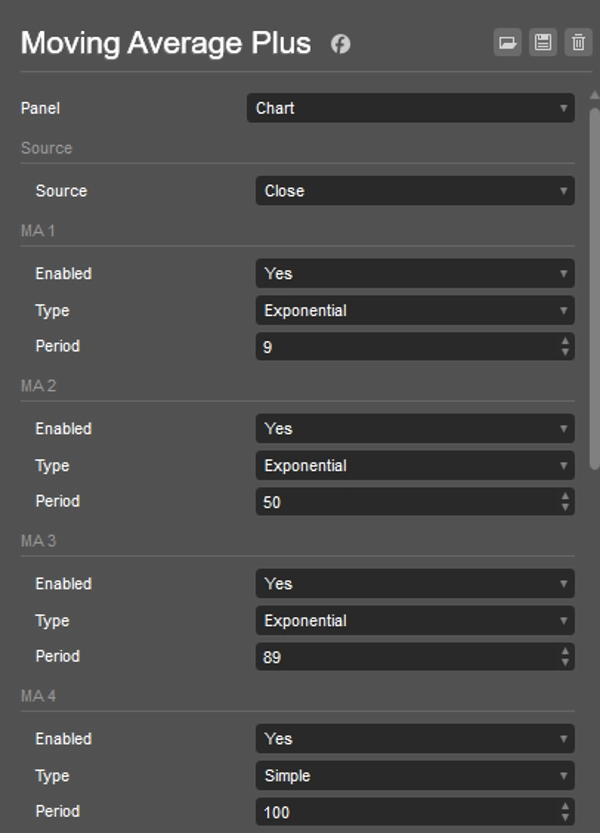
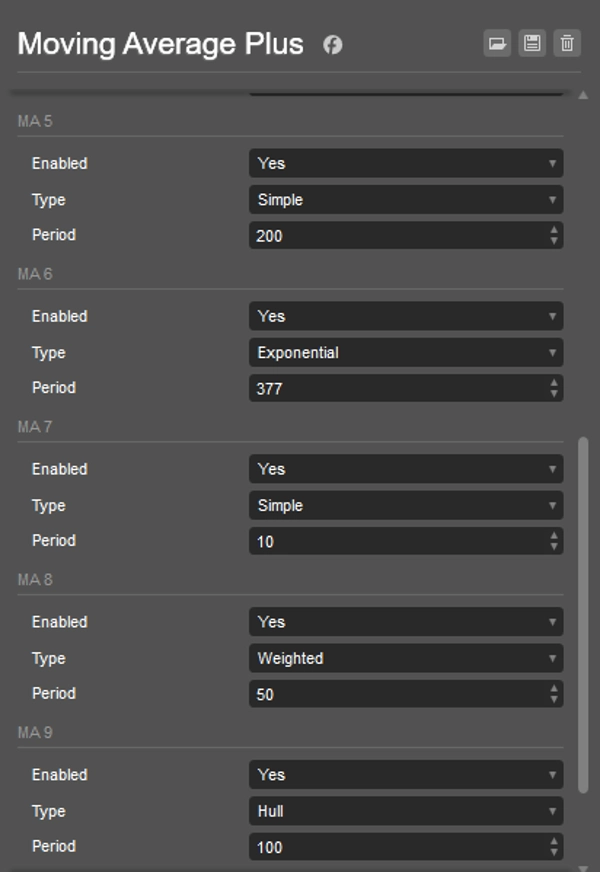
每条线(MA 1 … MA 10)
- 启用 – 开启/关闭该线(禁用的线条不会计算)。
- 类型 – 从 cTrader 的
MovingAverageType中选择任意一种(例如,简单、指数、加权、Wilder 平滑、Hull、三角形、时间序列等)。
注意: 某些类型取决于您的 cTrader 版本;如果某种类型不可用(例如 Hull),请选择其他类型。 - 周期 – 移动平均线长度(≥1)。
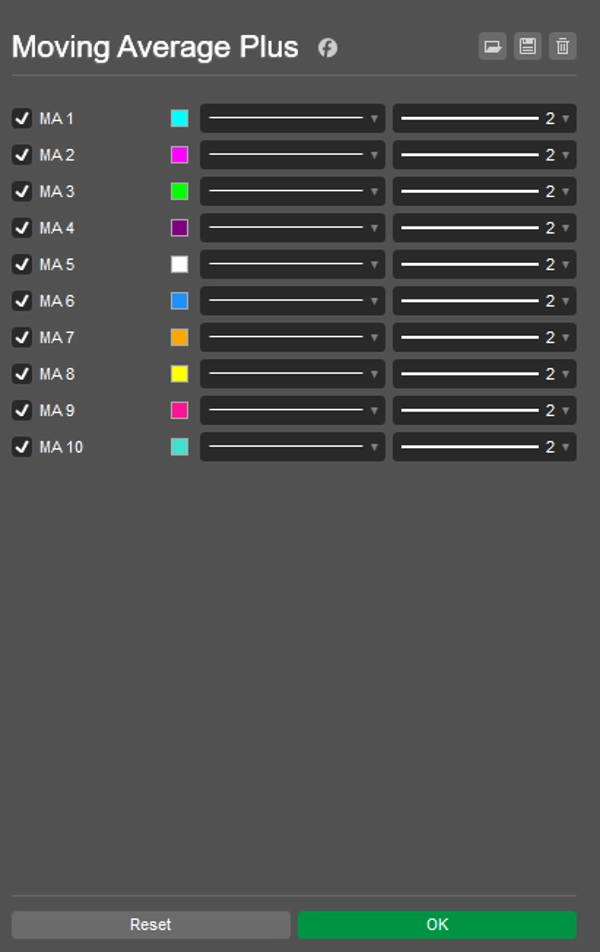
颜色和粗细
- 在指标参数的 颜色 选项卡中为每个输出(“MA 1” … “MA 10”)设置。
提示
- 为了性能,禁用未使用的线条。
- 如果您更改了 来源 或 类型/周期,指标会自动重新计算。
- cTrader 中的 Wilder 被命名为 Wilder 平滑 (
MovingAverageType.WilderSmoothing)。
摘要
AI 摘要
Moving Average Plus is a technical indicator for trading platforms that provides up to 10 configurable moving average lines. Each line can be individually enabled or disabled to optimize performance. Users select a single price source—such as Close, Open, High, Low, Median, Typical, or Weighted Close—that applies to all moving averages. For each line, the type of moving average can be chosen from various options including Simple, Exponential, Weighted, Wilder Smoothing, Hull, Triangular, and Time Series, depending on platform support. The period (length) of each moving average is adjustable with a minimum of 1. Colors and line thickness for each moving average are customizable through the indicator’s color settings. The indicator automatically recalculates when changes are made to the price source, type, or period. This tool is designed to assist traders in analyzing price trends by overlaying multiple moving averages with flexible configurations on their charts.
指标配置
客户评价
0.0
评价:0
客户评价
该产品尚无评价。已经试过了?抢先告诉其他人!
讨论
常见问答
cTrader Store 提供的所有产品,包括交易机器人、指标和插件,均由第三方开发者提供,仅供信息参考和技术访问之用。cTrader Store 并非经纪商,不提供投资建议、个人推荐或任何未来业绩保证。


!["[Stellar Strategies] Wave Trend Pro" 标识](https://cdn.ctrader.com/image/webp/5f226fbb-245a-41cd-9cdd-b018257d5e6d_28617)


价格
注册日期 26/05/2025
449.3M
交易量
61.1K
盈利点数
15
销售
1.43K
免费安装