
VSA
指标
269 下载
版本 1.0, Nov 2025
Windows 版、Mac 版
5.0
评价:1
说明
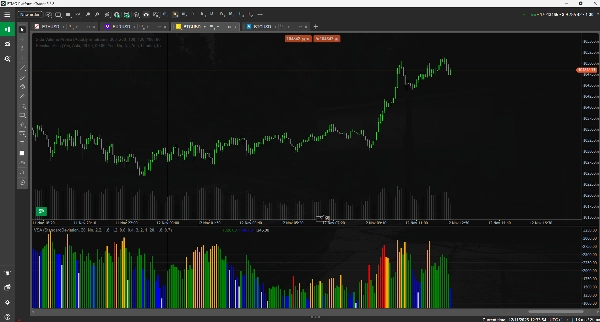
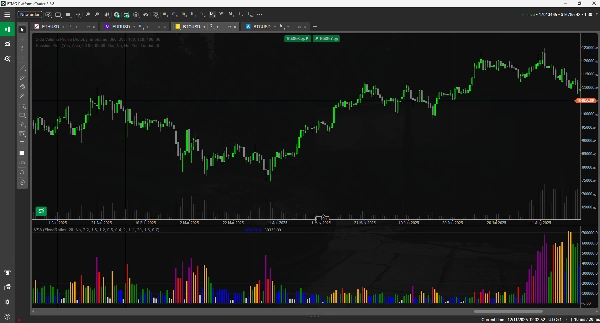
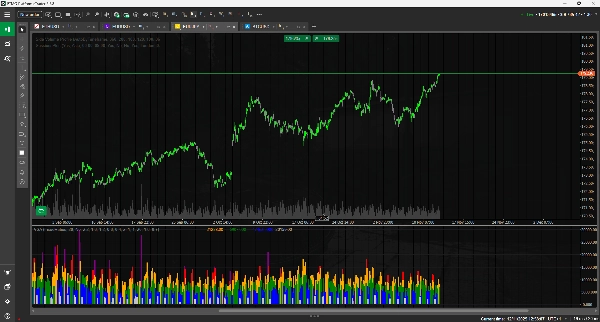
一个先进的多模式成交量指标,具有三种不同的分析模式。可即时切换以匹配您的交易风格。
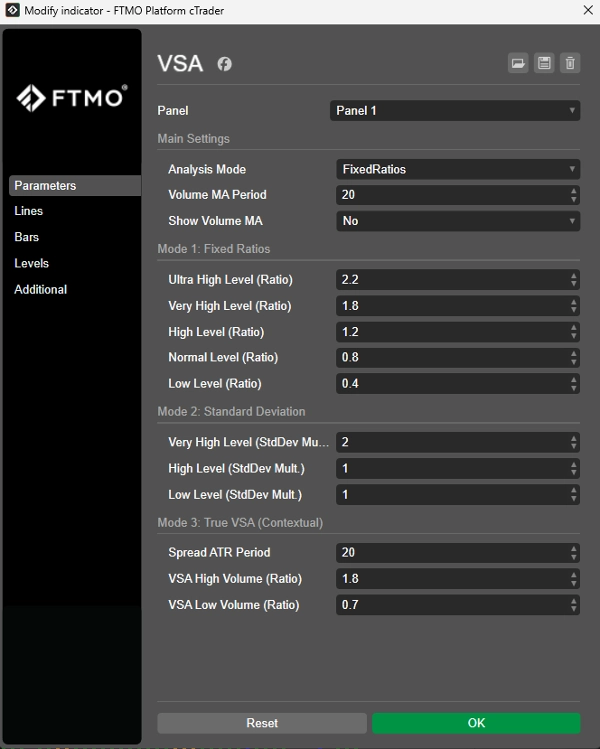
模式 1:固定比率
通过将成交量与其移动平均值乘以固定的用户定义比率(例如,“高”对应 2.0 倍)进行比较来分类成交量。
适合:偏好手动控制和固定阈值的交易者。
模式 2:标准差(自适应)
此模式会自动根据市场波动性进行调整。它根据成交量距离均值(移动平均)多少个标准差来分类成交量。
适合:一种自适应工具,可“开箱即用”于任何工具或时间框架。
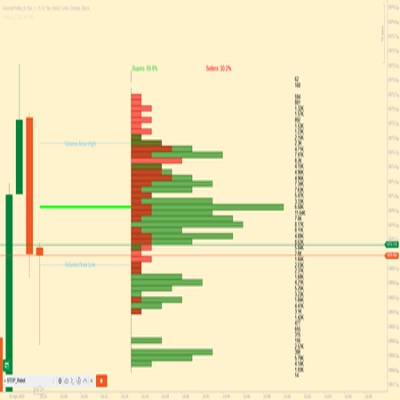
模式 3:真实 VSA(上下文)
经典的专业方法。此模式通过结合成交量 + 价差(区间)+ 收盘位置来分析K线的上下文,以识别关键信号。
摘要
AI 摘要
The VSA indicator is an advanced volume analysis tool offering three distinct modes to suit different trading approaches.
1. Fixed Ratios mode categorizes volume by comparing it to a moving average multiplied by user-defined fixed ratios, providing manual control over volume thresholds.
2. Standard Deviation mode adapts automatically to market volatility by classifying volume based on its deviation from the moving average, suitable for use across various instruments and timeframes without manual adjustment.
3. True VSA (Contextual) mode applies a professional volume spread analysis by evaluating volume in conjunction with bar range and close position to identify key market signals.
This multi-mode indicator supports a wide range of markets including Forex, cryptocurrencies (e.g., BTCUSD, ETH), commodities (e.g., gold, oil), indices (e.g., NAS100, SP500), and stocks. It enables traders to switch instantly between modes to align with their preferred analysis style and trading strategy.
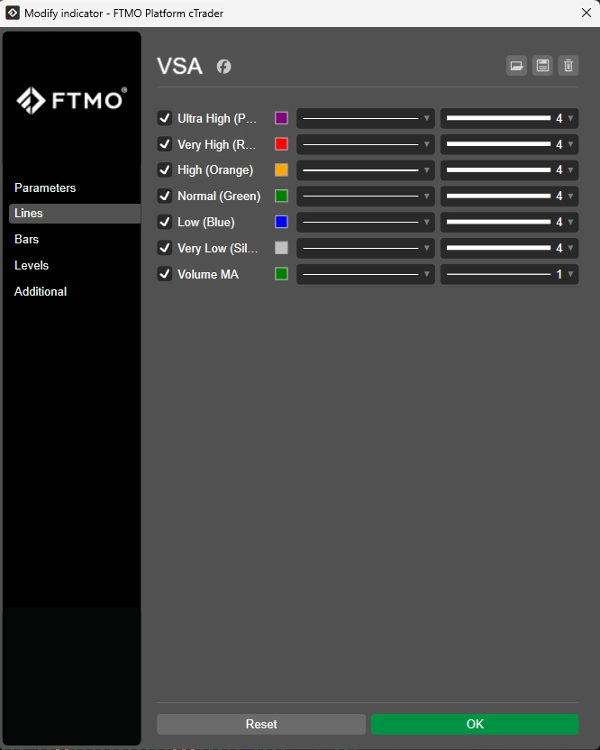
指标配置
客户评价
5.0
评价:1
5 | 100 % | |
4 | 0 % | |
3 | 0 % | |
2 | 0 % | |
1 | 0 % |
讨论
常见问答
BTCUSD
Forex
Signal
Indices
EURUSD
Commodities
GBPUSD
NZDUSD
Prop
Crypto
Stocks
XAUUSD
NAS100
ATR
USDJPY
cTrader Store 提供的所有产品,包括交易机器人、指标和插件,均由第三方开发者提供,仅供信息参考和技术访问之用。cTrader Store 并非经纪商,不提供投资建议、个人推荐或任何未来业绩保证。
该作者的其他作品


价格
注册日期 26/05/2025
389.95M
交易量
60.75K
盈利点数
15
销售
1.41K
免费安装