
说明
超灵活的VWAP指标,具有高级自定义功能:
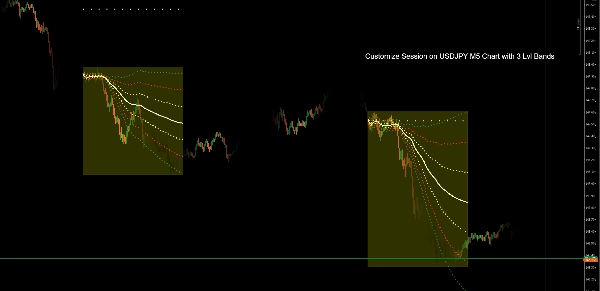
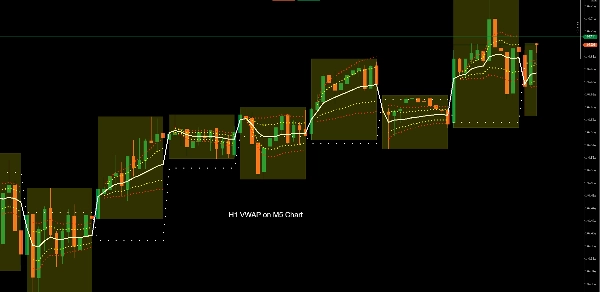
- 智能标准差带:支持最多3个可调STD带,精准市场分析
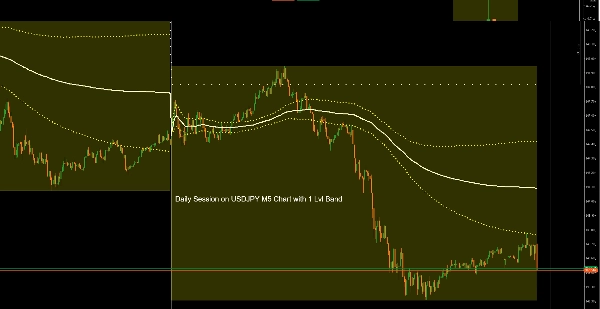
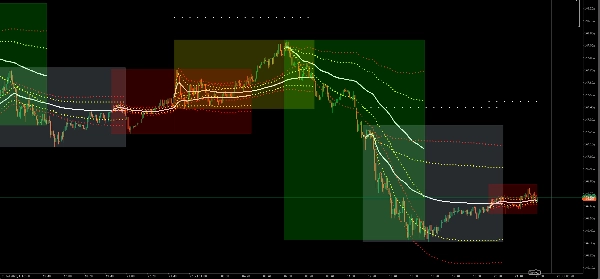
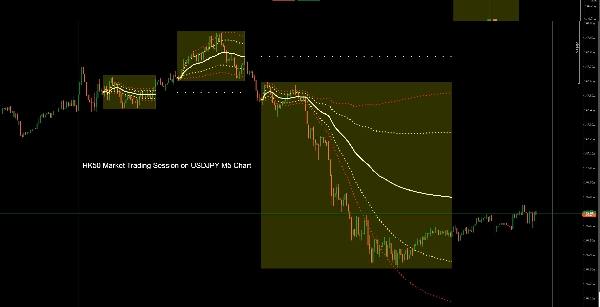
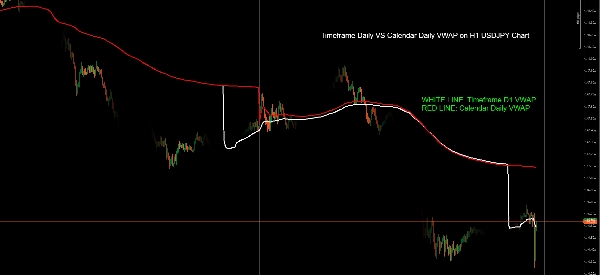
- 多会话适应性:可选择FX/市场时间/日历日/时间框架/手动会话
- 增强的会话工具:包括前一会话枢轴点和可视会话框标记
- 周末数据控制:可选包含周六/周日数据进行计算
- 专业级自定义:完全可配置参数,适合个性化交易策略
摘要
指标配置
客户评价
5.0
评价:1
5 | 100 % | |
4 | 0 % | |
3 | 0 % | |
2 | 0 % | |
1 | 0 % |
客户评价
August 9, 2025
Awesome! This is exactly the VWAP Bands indicator I was looking for. It includes the VWAP line and three adjustable standard deviation bands. The sessions are fully customizable, so you can display any time range you want. With extras like previous session pivots & session highlighting. Recommended!
讨论
常见问答
cTrader Store 提供的所有产品,包括交易机器人、指标和插件,均由第三方开发者提供,仅供信息参考和技术访问之用。cTrader Store 并非经纪商,不提供投资建议、个人推荐或任何未来业绩保证。
该作者的其他作品


价格
9
销售
16
免费安装