

说明
市场结构专家 – 趋势线、区域与智能入场
市场结构专家是一套完整的价格行为工具包,能够自动绘制市场的波动结构、关键支撑/阻力、真实趋势线和高点/低点区域——并可选择性地通过内置确认逻辑突出显示高概率的回调入场点。
该指标无需手动绘制所有内容,而是在后台持续扫描您的图表,实时保持结构、区域和信号的最新状态。
该指标功能
- 自动支撑与阻力
-
- 检测可配置回溯范围内的波动高点/低点。
- 使用点差容差将附近水平线合并为更清晰的区域。
- 在任意选定时间框架上绘制交互式支撑阻力线(例如,M15入场上的4小时支撑阻力)。
- 支撑和阻力线的厚度与颜色完全可自定义。
- 真实外部趋势线
-
- 从验证过的波动点构建上升/下降的支撑和阻力趋势线。
- 控制显示每个方向的趋势线数量,并将其延伸至未来。
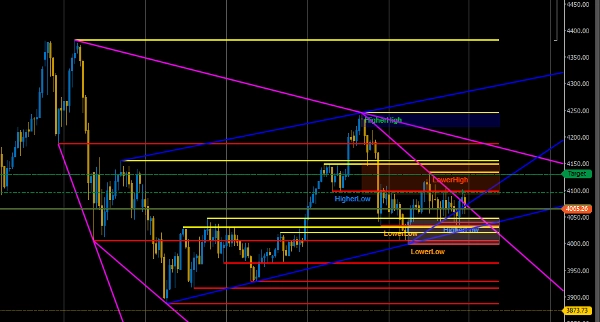
- 市场结构映射(高高点、低高点、高低点、低低点)
-
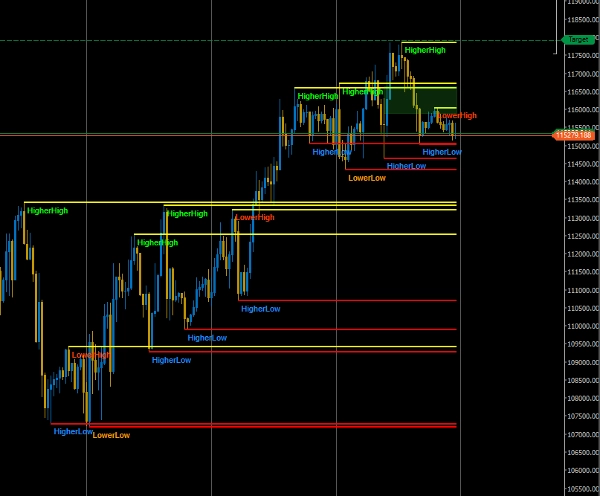
- 直接在图表上标注更高高点、更高低点、更低高点、更低低点波动。
- 可调节的最小波动距离(点数)以过滤市场噪音。
- 限制活动标签数量,保持图表整洁。
- 实时文本显示“当前趋势”(上涨趋势/下跌趋势/横盘,含反转提示)。
- 内置“下一结构预测”消息,提供方向性背景。
- 高高点/低低点源蜡烛区域
-
- 自动绘制来自最后的高高点和低低点源蜡烛的区域。
- 三种区域模式:
-
- 完整蜡烛(高 ↔ 低)
- 仅实体(开盘/收盘范围)
- 仅影线(高高点用上影线,低低点用下影线)
- 区域填充(点数)、不透明度、长/短区域颜色,以及是否延伸至当前柱的选择。
- 智能入场信号(可选)
-
- 主开关控制所有入场信号的开启/关闭。
- 波动回调入场:
-
- 使用最新的冲击波段(高高点–高低点或低高点–低低点)。
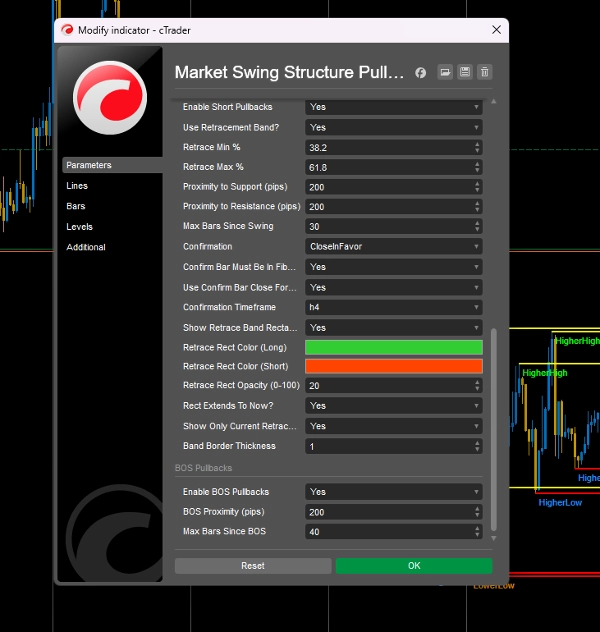
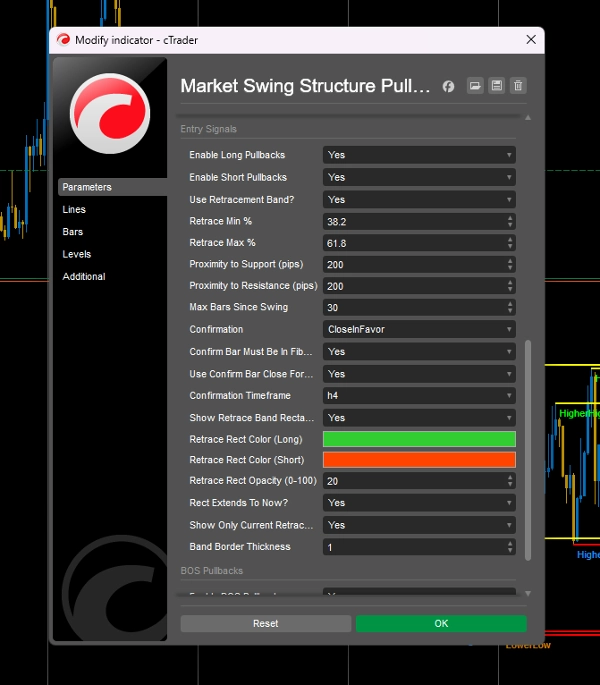
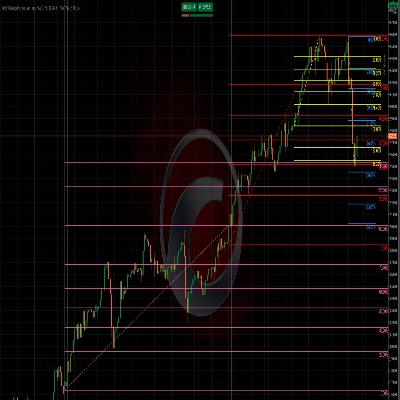
- 构建斐波那契风格的回撤带(例如38.2%–61.8%)用于买卖。
- 检查与波动点和支撑阻力水平的接近度。
- 限制信号在波动后的有效柱数。
- 结构突破(BOS)回调:
-
- 通过关键的低高点/高低点突破检测BOS。
- 寻找BOS水平及附近支撑阻力的回测。
- 使用独立的接近度和“自BOS以来的柱数”过滤器。
- 确认引擎
-
- 多种入场确认模式:
-
- 仅收盘价有利
- 仅吞没蜡烛
- 收盘价 + 吞没
- 无(原始信号)
- 可选要求确认蜡烛也必须位于回撤带内。
- 独立确认时间框架(例如在H4确认,同时交易M15)。
- 您可以选择使用确认柱收盘价作为实际信号的价格/时间。
- 视觉与性能控制
-
- 可调节标签偏移、字体大小和最大结构标签数。
- 回撤带和区域的矩形不透明度、边框厚度及“延伸至当前”行为。
- 基于计时器的更新,确保即使在较低时间框架上计算也高效。
适用对象
- 依赖市场结构(高高点/高低点/低高点/低低点)的价格行为交易者。
- 希望在入场图表上看到更高时间框架支撑阻力和趋势线的波段和日内交易者。
- 寻找围绕关键结构、区域和BOS水平的基于规则的回调入场,并带有明确确认的交易者。
使用方法
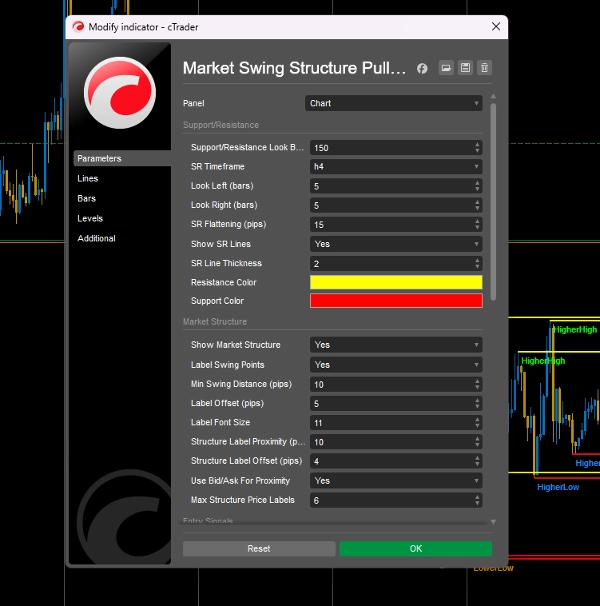
- 选择您的支撑阻力时间框架(例如H4)和回溯范围。
- 启用趋势线,并调整是否延伸及过滤周末跳空。
- 开启市场结构和标签,查看高高点/高低点/低高点/低低点及实时趋势/预测。
- 启用区域,选择您偏好的范围模式(完整、实体或仅影线)。
- 如果需要信号,启用入场信号,设置您的回撤带(例如38.2%–61.8%)、接近度和确认行为。
您仍然控制风险管理和执行——市场结构专家为您提供了一个结构化、可视化的框架,让您专注于决策,而非绘图。
摘要
AI summary
Market Structure Pro is a price-action indicator designed to automate the identification and visualization of key market elements for traders. It automatically detects swing highs and lows to map support and resistance zones, consolidating nearby levels into cleaner zones with customizable appearance. The indicator draws validated ascending and descending trendlines and labels market structure swings as Higher Highs, Higher Lows, Lower Highs, and Lower Lows, providing live trend status and next structure predictions.
It features auto-drawn zones based on the last Higher High and Lower Low source candles, with options for full candle, body only, or wick-only ranges. Smart entry signals include swing pullback entries using Fibonacci-style retracement bands and break-of-structure (BOS) pullbacks, both filtered by proximity and time since the swing or BOS event. A confirmation engine supports multiple modes such as close-in-favor, engulfing candles, or combined confirmations, with configurable confirmation timeframes and signal price options.
Visual and performance controls allow adjustment of label offsets, font sizes, opacity, and update frequency to maintain chart clarity and efficiency. Market Structure Pro supports various markets including Forex, indices, commodities, stocks, and cryptocurrencies, and is suitable for price-action, swing, and intraday traders seeking structured, rule-based analysis and entry signals without manual drawing.
It features auto-drawn zones based on the last Higher High and Lower Low source candles, with options for full candle, body only, or wick-only ranges. Smart entry signals include swing pullback entries using Fibonacci-style retracement bands and break-of-structure (BOS) pullbacks, both filtered by proximity and time since the swing or BOS event. A confirmation engine supports multiple modes such as close-in-favor, engulfing candles, or combined confirmations, with configurable confirmation timeframes and signal price options.
Visual and performance controls allow adjustment of label offsets, font sizes, opacity, and update frequency to maintain chart clarity and efficiency. Market Structure Pro supports various markets including Forex, indices, commodities, stocks, and cryptocurrencies, and is suitable for price-action, swing, and intraday traders seeking structured, rule-based analysis and entry signals without manual drawing.
指标配置
客户评价
4.3
评价:3
5 | 33 % | |
4 | 67 % | |
3 | 0 % | |
2 | 0 % | |
1 | 0 % |
客户评价
October 23, 2025
ngl, this one makes sense if you are not trying to yolo every signal. Keeping it on demo first and see how it behaves when liquidity moves gets messy.
October 20, 2025
tested like a normal trader would, small size first. The idea is fine, but No need to scale it before seeing how it handles bad days.
October 10, 2025
I liked it more as a extra filter for smart money style analysis than as something to follow blindly. Structure is easier to map, and the final decision still feels like it belongs to the trader.
讨论
常见问答
Fibonacci
Forex
Commodities
Crypto
Stocks
XAUUSD
cTrader Store 提供的所有产品,包括交易机器人、指标和插件,均由第三方开发者提供,仅供信息参考和技术访问之用。cTrader Store 并非经纪商,不提供投资建议、个人推荐或任何未来业绩保证。

猜您喜欢















价格
注册日期 31/10/2024
59
销售
1.82K
免费安装