
TrendStrengthSignals
Индикатор
Версия 1.0, Aug 2025
Windows, Mac
5.0
Отзывы: 1
С 26/05/2025
381.37M
Торгуемый объем
60.65K
Выигранные пипы
14
Продажи
1.39K
Бесплатные установки
Описание
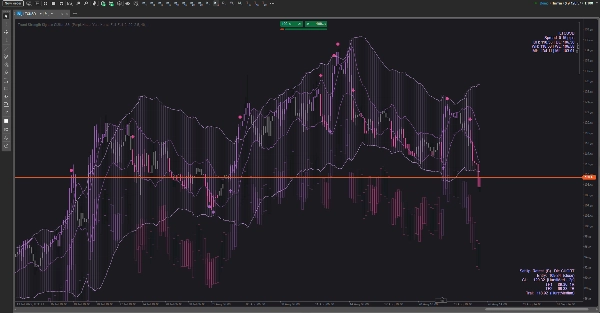
Визуальный набор инструментов для трендовой торговли, который сочетает в себе волатильную оболочку с каналом, учитывающим циклы, чтобы мгновенно показать режим, время и риск. Он разработан так, чтобы быть читаемым на любом фоне (светлом/темном) и сохранять экран чистым, при этом давая подсказки о «что делать дальше».
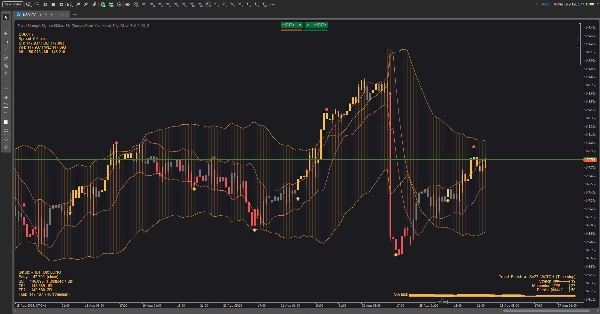
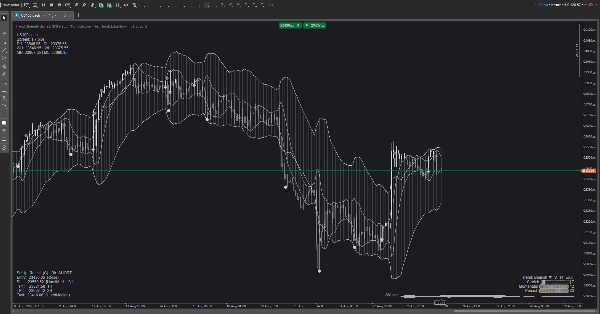
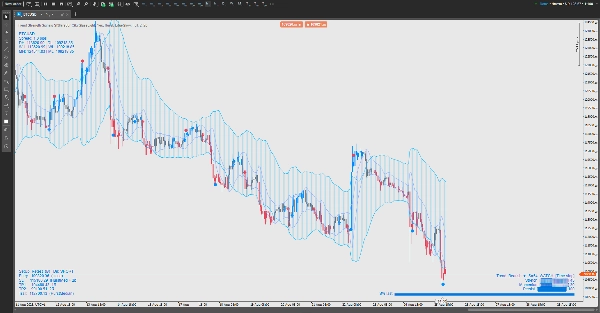
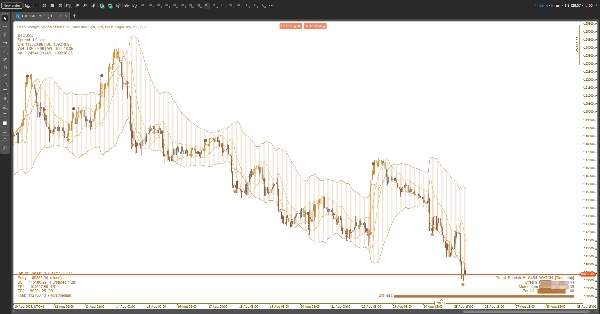
Что вы видите на графике
- Облака (включаемые):
-
- Волатильное облако, которое расширяется/сжимается в зависимости от активности рынка.
- Циклическое облако, которое отслеживает текущий ритм цены.
- Вы можете показывать одно, оба или ни одного.
- Сигналы: ненавязчивые стрелки вверх/вниз для возможных смен тренда; маленькие точки для подтолкнутия к фиксации прибыли.
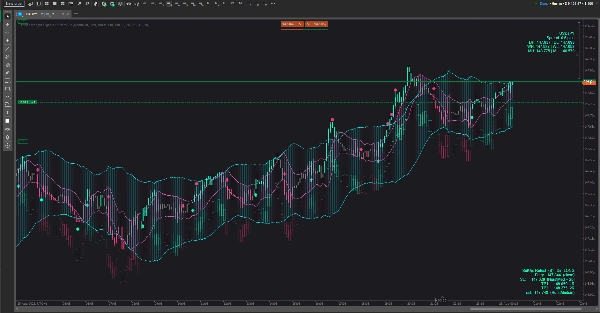
- Индикатор силы тренда (HUD) (три стиля):
-
- Легкий — компактный статусный тег.
- Профессиональный — маленькая панель с тремя измерителями (растяжение, импульс, устойчивость) плюс мини-график истории.
- Лента — мягкая полоса рядом с ценой, интенсивность которой следует за силой тренда.
- Индикатор риска (HUD): предлагает направление, защитную зону стопа, два уровня целей по прибыли и опциональную идею трейлинга. Размещается в любом углу по вашему выбору и обновляется по мере развития бара.
- Индикатор рынка (HUD): символ и спред, а также дневные/недельные/месячные максимумы и минимумы, чтобы вы всегда знали, где находитесь на большой карте.
- Темы: подобранные цветовые схемы для светлых и темных графиков (и режим Custom). Все графические элементы — включая HUD и сигналы — следуют активной теме.
Как использовать (практически, не технически)
- Выберите вид облака:
-
- Используйте волатильное облако, чтобы видеть сжатия и расширения.
- Используйте циклическое облако, чтобы оценивать «край» и «середину» вращений.
- Используйте оба, если хотите контекст и тайминг.
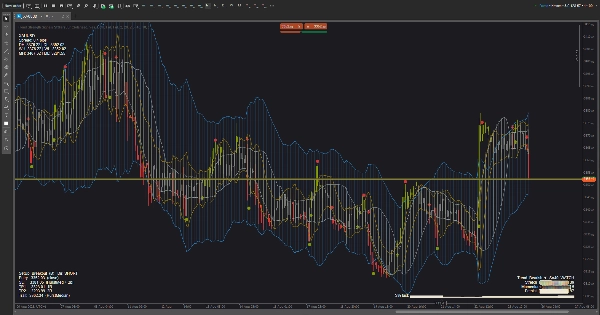
- Читайте силу тренда:
-
- Когда статус повышается до HOLD, ориентируйтесь на текущую направленность; когда падает до WATCH, снижайте агрессивность; если показывает EXIT, избегайте новых сделок или ужесточайте риск.
- В режиме Pro, растущие индикаторы + растущий мини-график = улучшение качества; падающие индикаторы = управляйте риском вниз.
- Таймируйте входы по цене относительно облака:
-
- Выходы после сжатия, повторные входы после аккуратного отката к облаку или отскоки от внешнего края — основные шаблоны.
- Если ранняя стрелка появляется в середине бара и затем исчезает, дождитесь подтверждения закрытия бара, если предпочитаете меньше ложных сигналов.
- Управляйте сделкой с помощью Risk HUD:
-
- Размещайте защитный стоп примерно за ближайшей структурной границей, которую выделяет HUD.
- Частично фиксируйте прибыль на TP1, остальное направляйте на TP2 или следуйте предложенной линии трейлинга.
- Если сила тренда снижается с сильной до слабой, рассмотрите возможность более раннего выхода.
- Ситуационные фильтры:
-
- Избегайте входов, когда облака тонкие и рваные, или когда статус силы находится в EXIT.
- Предпочитайте сделки, когда сила нарастает, облако наклонено, и цена чисто взаимодействует с краями.
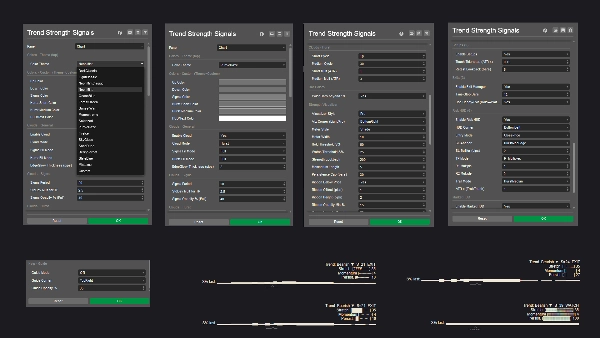
Настройка
- Меняйте углы HUD, стиль визуализации и цветовую тему, чтобы соответствовать вашему рабочему пространству.
- Темы, удобные для светлых фонов, сохраняют видимость текста на белом фоне; палитры океан/лес/закат добавляют тонкий контраст без бликов.
Чем это не
Это не черный ящик автотрейдера. Это помощник в принятии решений: он оценивает качество тренда, предлагает разумные уровни риска и выделяет моменты с высокой вероятностью — но вы остаетесь в контроле.
Сводка
Профиль индикатора
Отзывы покупателей
5.0
Отзывы: 1
5 | 100 % | |
4 | 0 % | |
3 | 0 % | |
2 | 0 % | |
1 | 0 % |
Отзывы покупателей
September 2, 2025
The reason it feels usable is direction is easier to respect, and a 1R exit plan makes review easier.
Обсуждение
Частые вопросы
Продукты, доступные в cTrader Store, включая торговых ботов, индикаторы и плагины, предоставляются сторонними разработчиками и доступны исключительно в информационных и технических целях. cTrader Store не является брокером и не предоставляет инвестиционные консультации, персональные рекомендации или какие-либо гарантии будущей доходности.


Цена
С 26/05/2025
381.37M
Торгуемый объем
60.65K
Выигранные пипы
14
Продажи
1.39K
Бесплатные установки