
Donchian Channel Pro
지표
버전 1.0, Aug 2025
Windows, Mac
4.5
리뷰: 2
설명
돈치안(돌파) 전략을 사용한 거래 방법
- 매수 가격이 N기간 최고가(상단)를 돌파할 때.
- 매도 가격이 N기간 최저가(하단)를 돌파할 때.
- 보유 추세가 지속되는 동안 포지션을 유지하며, 반대 돌파 시 또는 트레일링 스톱으로 청산.
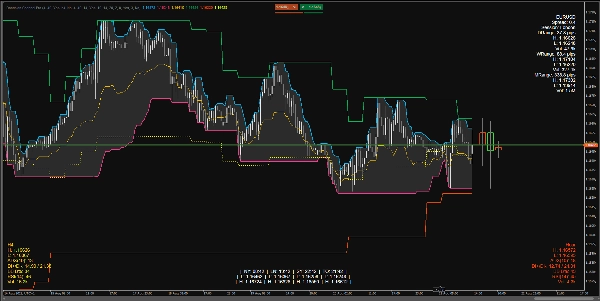
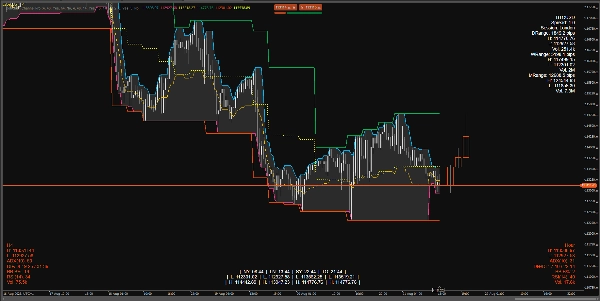
차트에서 지표가 보여주는 것
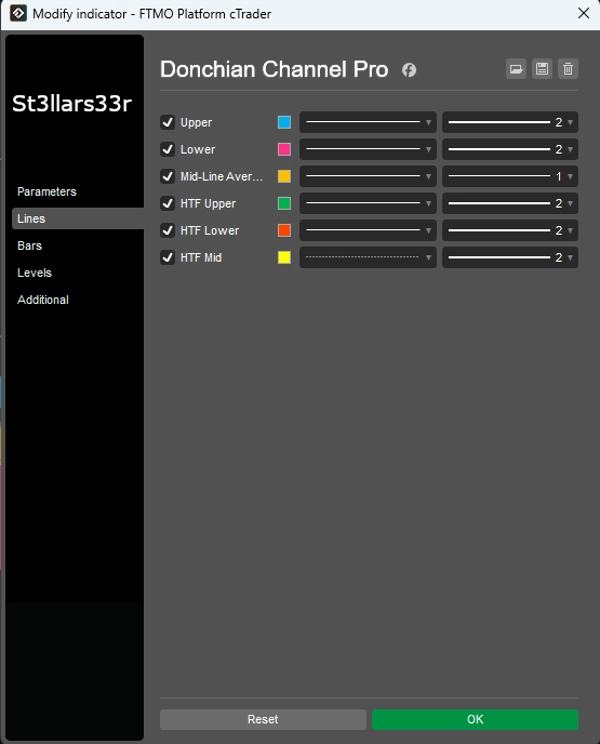
현재 시간 프레임(TF)의 돈치안:
- 상단: 상단 채널 바 중 최고가.
- 하단: 하단 채널 바 중 최저가.
- 중간: 상단과 하단의 중간 지점.
HTF 오버레이: 상위 시간 프레임의 돈치안 라인이 차트에 오버레이됨:
- HTF 상단, HTF 하단, HTF 중간
- HTF 캔들 HUD: 상위 시간 프레임 캔들을 나타내는 사각형, 현재 TF의 마지막 바 오른쪽에 고정됨.
하단/상단 HUD(헤드업 디스플레이):
- 우측 상단: 심볼 정보 + 일간/주간/월간 범위 패널.
- 좌측 하단: 상위 시간 프레임 HUD(상위 TF 지표).
- 우측 하단: 중간 TF HUD(중간 시간 프레임 지표).
- 중앙 하단: 세션 시계 + 각 세션별 고가/저가(지속 표시).
각 HUD가 표시하는 내용
우측 상단 (Top Right)
- 심볼명
- 스프레드: 핍 단위 스프레드.
- 세션: 현재 활성 세션(지정된 시간 기준).
- 일간/주간/월간 범위: 핍 단위 일간/주간/월간 범위.
- 고가/저가/거래량: 해당 기간의 고가/저가 및 총 거래량.
좌측 하단 (Bottom Left) — 상위 TF HUD
- TF 이름 (예: H4, D1 등)
- 고가/저가: 마지막(또는 활성) 상위 TF 바의 현재 고가/저가.
- ADX(n), DI+/DI-: 추세 지표.
- BB B%: 상위 TF 볼린저 밴드 내 현재 가격 위치(0은 하단 밴드 근처, 100은 상단 밴드 근처).
- RSI(n)
- 거래량: 상위 TF 거래량.
- HUD 색상:
-
- 녹색: 범위가 위로 확장 중(DI+ 및 ADX 상승).
- 빨간색: 하락 압력 증가(DI- 상승).
- 노란색: 중립/정의되지 않음.
우측 하단 (Bottom Right) — 중간 TF HUD
- 상위 TF HUD와 동일하지만 중간 시간 프레임용.
중앙 하단 (Bottom Center) — 시계 + 세션 고가/저가
- 시간: NY, LN, SY, TO.
- 저가/고가: 각 세션별.
- 지속 로직: 세션이 비활성일 때 마지막 완료 세션의 고가/저가를 표시하며, 새 세션 시작 시 값이 초기화되고 재계산됨.
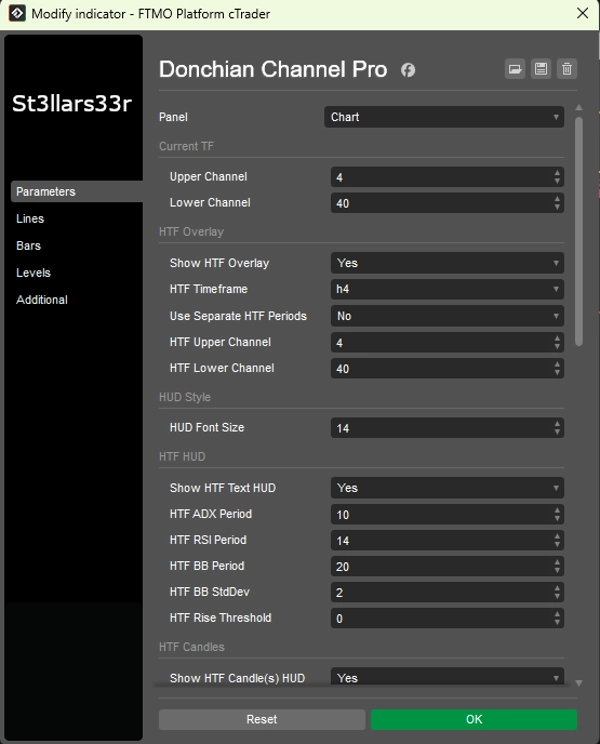
매개변수 및 사용 방법
그룹: 현재 TF (현재 돈치안)
- 상단 채널: 상단 채널 바 개수. 값이 클수록 업데이트 빈도 감소, 선이 평탄해짐.
- 하단 채널: 하단 채널 바 개수.
그룹: HTF 오버레이 (상위 시간 프레임 돈치안 오버레이)
- HTF 오버레이 표시: 차트에 HTF 라인 표시 활성화.
- HTF 시간 프레임: 상위 시간 프레임 선택(예: Hour4).
- 별도 HTF 기간 사용: true면 HTF 상단/하단이 자체 매개변수를 사용; false면 현재 상단/하단 사용.
- HTF 상단 채널: HTF 상단 채널 길이.
- HTF 하단 채널: HTF 하단 채널 길이.
그룹: HUD 스타일
- HUD 글꼴 크기: 모든 HUD(우측 상단, 좌측 하단, 우측 하단, 중앙 하단)의 글꼴 크기.
그룹: HTF HUD (좌측 하단)
- HTF 텍스트 HUD 표시: HTF용 텍스트 HUD 표시.
- HTF ADX 기간: ADX/DI 기간. 값이 클수록 부드럽고 노이즈 적지만 반응 느림.
- HTF RSI 기간: RSI 기간.
- HTF BB 기간: 볼린저 밴드 기간.
- HTF BB 표준편차: BB 표준편차 배수(기본값 2.0).
- HTF 상승 임계값: 상승 지표 민감도(HUD 색상에 영향).
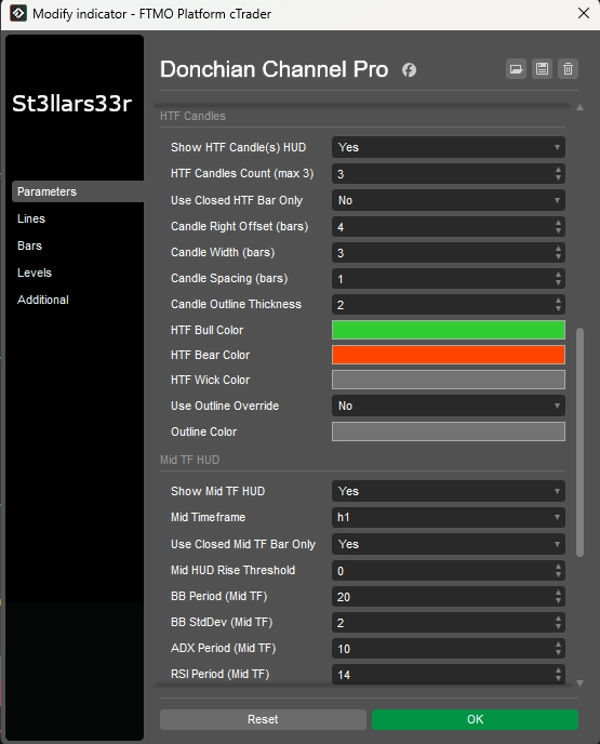
그룹: HTF 캔들 (우측, 마지막 바 근처)
- HTF 캔들 HUD 표시: 우측에 HTF 캔들 표시.
- HTF 캔들 개수 (최대 3): HTF 캔들 개수(1~3).
- 닫힌 HTF 바만 사용: true면 닫힌 HTF 캔들만 사용(안정된 값). false면 현재 열린 캔들 포함.
- 캔들 우측 오프셋(바): 현재 TF의 마지막 바(기준점)에서 오른쪽으로의 바 오프셋.
- 캔들 너비(바): 현재 TF 바 단위의 캔들 사각형 너비.
- 캔들 간격(바): 캔들 간 간격.
- 캔들 외곽선 두께: 캔들 외곽선 두께.
- HTF 상승 색상 / HTF 하락 색상: 상승/하락 캔들 색상.
- HTF 심지 색상: 심지 색상.
- 외곽선 오버라이드 사용: true면 캔들 몸통을 외곽선 색상으로만 그림(상승/하락 채우기 없음).
- 외곽선 색상: 외곽선 오버라이드가 true일 때 외곽선 색상.
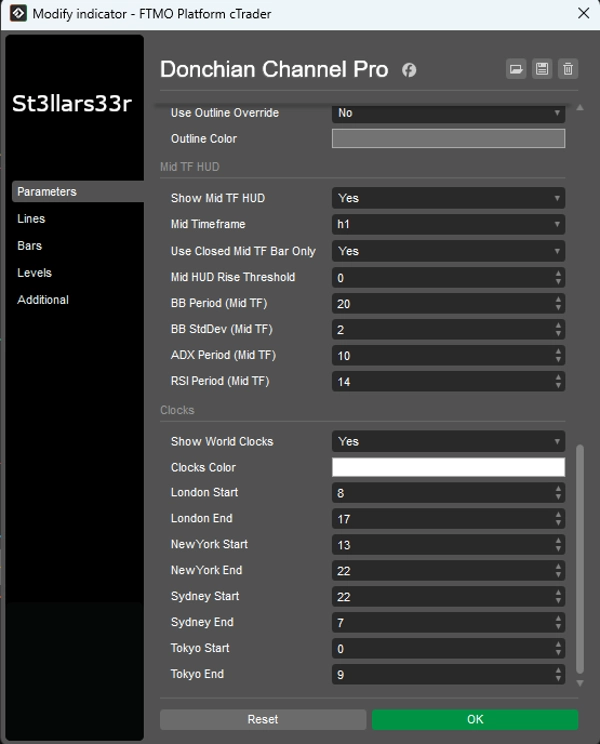
그룹: 중간 TF HUD (우측 하단)
- 중간 TF HUD 표시: 중간 시간 프레임용 HUD 활성화.
- 중간 시간 프레임: 중간 TF 선택(예: Minute15).
- 닫힌 중간 TF 바만 사용: HTF와 동일하지만 중간 TF용.
- 중간 HUD 상승 임계값: 중간 TF HUD 색상 민감도.
- BB 기간 (중간 TF), BB 표준편차 (중간 TF): 중간 TF용 볼린저 밴드 설정.
- ADX 기간 (중간 TF), RSI 기간 (중간 TF): 중간 TF용 ADX 및 RSI 기간.
그룹: 시계 (중앙 하단)
- 세계 시계 표시: 시계 및 세션 고가/저가 블록 표시.
- 시계 색상: 시계/세션 텍스트 색상.
- 런던 시작 / 런던 종료: 런던 세션 시작/종료 시간.
- 뉴욕 시작 / 뉴욕 종료: 뉴욕 세션.
- 시드니 시작 / 시드니 종료: 시드니 세션.
- 도쿄 시작 / 도쿄 종료: 도쿄 세션.
시계: 도시별 실제 현지 시간 표시(OS 시간대 사용, 대체 오프셋 포함).
- 세션 활동(및 고가/저가) 계산은 브로커 서버 시간(Server.Time)을 사용. 서버가 UTC가 아닐 경우 세션 시간이 이동할 수 있으니 서버에 맞게 시작/종료 시간 조정 필요.
- 세션이 자정을 넘길 경우(종료 < 시작), 지표가 자동으로 날짜 전환을 처리함.
- 세션이 비활성일 때는 마지막 완료 세션의 고가/저가를 표시하며, 새 세션 시작 시 데이터가 초기화되고 재계산됨.
요약
지표 프로필
고객 리뷰
4.5
리뷰: 2
5 | 50 % | |
4 | 50 % | |
3 | 0 % | |
2 | 0 % | |
1 | 0 % |
고객 리뷰
August 31, 2025
The setup still needs chart context before any serious size. It should stay in the support stack.
August 23, 2025
the review step feels less vague, but the setup still needs a person behind it, and manual context still matters.
상담
자주 묻는 질문(FAQ)
BTCUSD
Forex
Signal
Breakout
Indices
EURUSD
Commodities
GBPUSD
NZDUSD
Prop
Scalping
Supertrend
Crypto
Stocks
XAUUSD
NAS100
USDJPY
트레이딩 봇, 지표, 플러그인 등 cTrader Store에서 제공되는 상품은 제3자 개발자에 의해 제공되며, 이는 단순히 정보 및 기술적 접근을 목적으로 제공된 것입니다. cTrader Store는 중개인이 아니며, 투자 조언, 개인별 추천 또는 향후 성과에 대한 어떠한 보장도 제공하지 않습니다.


가격
가입일 26/05/2025
451.48M
거래량
61.16K
핍 수익
15
판매
1.43K
무료 설치